
Richard Lavaile sits down with Marco Gaietti, a veteran strategist whose management discipline meets market tape with unusual clarity. Today’s focus is ALGO at $0.11 in a tense $0.10–$0.12 box, where RSI at 57, a flatlined MACD, and Bollinger compression at 0.73 frame the risk. We explore how he reads momentum shifts, validates derivatives signals like a 1.31 long/short ratio and a 1.18 taker buy/sell, and adapts execution around the $0.12 inflection. We also cover how to treat $11.3 million in open interest after a -1.75% dip, what $4.4 million in daily volume really means, and how to translate a 70% odds-style view of a push to $0.13 into sizing, stops, and exits.
With ALGO near $0.11 and RSI around 57, how do you separate a neutral pause from a coiled spring? What confluence of indicators would you need to see before sizing up, and how do you avoid false starts when momentum looks stalled?
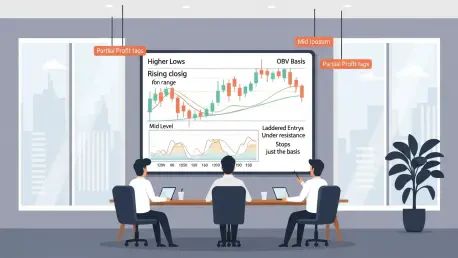
I treat RSI 57 as context, not a trigger, and look for alignment with structure. A higher low inside the $0.10–$0.12 range plus rising OBV and a MACD cross away from zero is my coiled spring. I also want price holding above mid-Bollinger while the 0.73 read edges toward the upper band. To avoid false starts, I wait for a 15–30 minute close above a prior micro swing and only add if pullbacks hold $0.11.
When the MACD histogram flatlines near zero, how do you detect the first credible shift in momentum? Which secondary signals—like volume footprints or order book changes—tip you off, and how do you validate them intraday versus on higher timeframes?
When the histogram hugs zero, I focus on rate-of-change and slope shifts. A flip from negative to positive bars with rising delta on upticks is my early tell. I corroborate with stacked bids stepping up a few ticks and fewer replenishing asks near $0.12. Intraday I want two higher lows; on higher timeframes I want a close above a weekly level inside the $0.10–$0.12 box.
If price sits around 0.73 within the Bollinger Bands, how do you interpret that positioning tactically? What would confirm a push toward the upper band near $0.12, and how do you structure entries to capture the move without chasing?
A 0.73 position says the lower band rejection held and momentum is leaning up. I want candles closing above the basis with shrinking lower wicks and rising volume. A tag-and-hold just under $0.12 is my trigger to take a starter, not a chase. I add on a retest if $0.11 holds and set a stop just below the basis.
In a tight $0.10–$0.12 range, what criteria tell you compression is genuinely near resolution? Which timeframes best reveal the “last lower high” or “first higher low,” and how do you scale positions ahead of a potential expansion?
True compression shows in narrowing ATR and cleaner swing symmetry. On the 1-hour, the last lower high forms just below $0.12; on the 4-hour, the first higher low often anchors around $0.11. I scale 30/40/30 across base, break, and retest. That keeps me engaged without being overexposed if $0.12 rejects.
With open interest near $11.3 million and a 24-hour drop of about 1.75%, how do you read that alongside a 1.31 long/short ratio among top traders? What scenarios signal smart accumulation versus crowded longs, and how do you position around them?
An OI dip of -1.75% with a 1.31 ratio says weak hands trimmed while strong hands leaned in. Smart accumulation shows as stable basis and flat funding with spot leading. Crowded longs show rising OI into $0.12 with fading volume and wicks. I buy the former with tight stops; I fade the latter with defined risk to $0.12.
A taker buy/sell ratio around 1.18 suggests aggressive buying—how do you confirm it’s true accumulation and not short-term hedging? Which metrics or trade tape patterns give you conviction, and how do you time entries when spot and perp signals diverge?
At 1.18 I’m looking for buyer-initiated prints that don’t get faded within minutes. True accumulation absorbs size near $0.11 and holds bid on pullbacks. I check if spot leads perps by a few ticks and if basis stays contained. If perps front-run, I wait for spot confirmation and enter on the next higher low.
Daily volume around $4.4 million can look modest—how do you distinguish “quiet accumulation” from apathy? What volume profile or delta characteristics precede breakouts in altcoins like ALGO, and how do you backtest those thresholds?
Modest $4.4 million is fine if upswings carry positive delta and downswings bleed on light prints. I like rising node development near $0.11 and shallow pullback volume. Before breakouts, I see cumulative delta grind up while price holds the mid-band. I backtest by tagging sessions where delta rose 3–5 days before $0.12 tests.
If there’s little commentary from major voices, how do you adjust your process when the narrative headwinds are light? What frameworks help you rely more on structure and liquidity, and how do you avoid echo chambers during silent phases?
Silence is a gift because structure speaks louder. I lean on market profile, session VWAPs, and simple levels at $0.10, $0.11, and $0.12. Liquidity maps and resting order clusters guide my risk. To avoid echo chambers, I predefine scenarios and review only objective stats daily.
With a 70% odds-style view of a break above $0.12 targeting $0.13 within 7–10 days, how do you translate that into trade sizing? What’s your stop placement logic, and how do you manage partial profits if momentum stalls just below resistance?
With 70% odds to $0.13, I size at half of max until we’re above $0.12. Stops sit just below the trigger or the basis, depending on entry, usually under $0.11. I peel 25–33% at $0.12 if momentum hesitates. If we drive cleanly, I trail under each higher low into $0.13.
If $0.12 rejects on declining volume, how do you pivot for a retest of $0.10—and potentially $0.09? What would invalidate the downside setup, and how do you manage risk during a cascade when liquidity thins?
A soft tap of $0.12 with shrinking volume is my short setup into $0.10. Continuation needs lower highs and failing bounces at the mid-band. A strong reclaim with volume back above $0.12 invalidates it. In a thin slide toward $0.09, I reduce size, widen stops modestly, and place bids only at pre-mapped liquidity.
When whales accumulate during consolidation, what on-chain or order flow tells you it’s strategic rather than opportunistic? How do you guard against mistaking spoofing or iceberg tactics for genuine demand, and what time-based filters do you apply?
Strategic flow repeats at the same prices and time windows, often around $0.11. Genuine demand absorbs and holds, with fewer re-offers near $0.12. Spoofs vanish on approach and don’t print; icebergs refill but don’t chase. I use a 3-session rule: if behavior persists across three sessions, I trust it.
With spot and derivatives painting different pictures, how do you prioritize signals? Which leads more often for ALGO—perp funding, basis, or spot liquidity—and how do you reconcile conflicting readings in real time?
I default to spot liquidity because it anchors the tape. For ALGO, basis and funding help, but spot bids near $0.11 have been more honest. If funding flips while spot digs in, I back the spot. I reconcile by waiting for alignment or trading smaller until $0.12 resolves.
For execution around the $0.12 inflection, what’s your step-by-step playbook? How do you stage bids or stops, handle slippage during a decisive break, and avoid getting trapped in a fakeout wick?
I ladder entries just below $0.12 with a confirmation tranche on a 15–30 minute close above it. Stops sit under the breakout bar or basis. To manage slippage, I use limit-into-strength orders and leave a small market slice. I avoid fakeouts by demanding volume and a hold above the level on the next candle.
If the move extends to $0.13, which follow-through metrics confirm trend continuation versus exhaustion? What would you watch—RSI behavior, OBV, or market depth—and how quickly would you trail stops to protect gains?
I want RSI to ride high without bearish divergence and OBV to stair-step up. Market depth should show rising bids stepping closer to price. If $0.13 attracts sticky offers and delta fades, I tighten quickly. I trail under each micro higher low and lock at least 50% if momentum stalls.
What is your forecast for ALGO over the next month, and which specific signals would most likely change your view mid-trade?
My base case is the 70% path: a break above $0.12 and a tag of $0.13 within 7–10 days, then consolidation. If $0.12 fails again, I expect a retest of $0.10 and, in stress, a quick flush to $0.09. I’ll change tack if the 1.31 ratio collapses, the 1.18 taker skew flips, or $11.3 million OI rebuilds bearishly. A decisive reclaim and hold above $0.12 with rising $4.4 million-plus volume keeps me constructive.
Do you have any advice for our readers?
Trade the level, not the story. Map $0.10, $0.11, and $0.12, then let RSI 57, the zero MACD, and the 0.73 band position guide your risk. Respect the odds—70% is not 100%—and size so a wrong read to $0.09 doesn’t ruin your month. Most of all, wait for the market to show its hand, then press your edge with discipline.


