
The current state of the digital asset market suggests that even the most established layer-two solutions must undergo periods of extreme price compression before achieving significant structural recoveries. Polygon, widely recognized by its ticker MATIC, has recently entered a technical phase that historically precedes a sharp reversal in trend, characterized by a decrease in selling pressure and a stabilization of core momentum oscillators. This specific market environment often creates a unique window for institutional players to build positions while the broader retail sentiment remains cautious or indifferent. As the asset navigates these localized lows, the convergence of technical floor signals and low-volatility accumulation patterns indicates that a mean-reversion move toward higher liquidity zones is not only possible but increasingly probable. Traders and analysts are now closely watching the interaction between current spot prices and major moving averages to determine if this setup will translate into a sustained upward trajectory.
Technical Indicators and Market Momentum
Oversold Conditions and Momentum Shifts
The primary driver behind the current bullish thesis for Polygon is the Relative Strength Index (RSI), which has settled at a reading of 38, placing the asset firmly within the oversold territory that typically attracts value investors. Such levels suggest that the recent downward trend has likely exhausted its immediate supply, leaving a vacuum that can be filled by even a modest increase in buying volume from institutional desks. Furthermore, the Moving Average Convergence Divergence (MACD) has reached a critical zero-point threshold, a technical development that has historically served as a precursor to double-digit percentage gains for the token. When the MACD histogram begins to flatten near the zero line during a period of low price action, it often signals that the bearish momentum has dissipated, allowing the underlying market structure to reset in preparation for a new impulse move. This alignment of oscillators provides a statistically significant foundation for a relief rally, as the lack of aggressive selling pressure creates a path of least resistance toward the upside.
The stability of the derivatives market further reinforces the potential for a clean breakout, as neutral funding rates indicate that the anticipated move is not being fueled by excessive retail leverage. In previous market cycles, high-leverage environments often led to “long squeezes” that invalidated bullish setups, but the current data suggests a much healthier spot-driven accumulation phase. By maintaining a neutral funding environment, the market avoids the risk of sudden liquidations that could dampen the impact of a price recovery. This lack of speculative excess allows the technical indicators to play out with greater precision, as the price action reflects actual demand rather than temporary liquidations of over-leveraged positions. Consequently, the transition from a bearish to a neutral momentum state on the daily timeframe provides a clear signal that the sellers have lost their dominance over the short-term price discovery process. This shift is essential for establishing the confidence required for a breakout toward the primary resistance levels currently being monitored by the broader trading community.
Volatility Squeeze and Accumulation Patterns
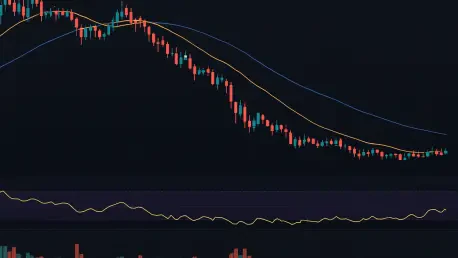
Current price action is also defined by an extreme compression of the Bollinger Bands, a phenomenon known as a volatility squeeze that often acts as a coiled spring for future market movements. When the width of these bands narrows significantly, it indicates that the market is in a state of high tension where a breakout in either direction is likely to be aggressive and sustained. In the context of Polygon’s current consolidation near the $0.38 mark, this squeeze suggests that the period of quiet trading is nearing its conclusion and will likely resolve in a sharp move toward established overhead targets. Historical data shows that these periods of low volatility are rarely permanent and typically serve as the quiet before a significant shift in market trend. For participants looking for high-probability setups, the narrowing of the bands provides a clear visual representation of a market that is searching for a catalyst to break out of its current narrow range and retest previous supply zones.
Despite a relatively quiet daily spot volume of approximately $1.07 million on major exchanges, this low-activity environment is often interpreted by professional analysts as a strategic accumulation phase. During such periods, large-scale institutional players often execute small, consistent buy orders to build their positions without triggering the “fear of missing out” that typically drives retail participation and spikes prices prematurely. This quiet absorption of available supply effectively thins out the order books, making it much easier for the price to move upward once a formal breakout is initiated. This type of price action is common in the lead-up to a recovery, as the transfer of assets from short-term speculators to long-term holders reduces the overhead resistance that would otherwise hinder a rally. By observing these volume patterns alongside the volatility squeeze, it becomes evident that the market is currently preparing for a tactical shift that could see a rapid transition from consolidation to a targeted relief move.
Price Targets and Risk Mitigation
Strategic Objectives and Resistance Levels
The primary objective for this projected recovery is the 50-day Simple Moving Average (SMA), which currently sits at the $0.45 level and represents an approximate 18% upside from the current trading range. This specific moving average often serves as a magnet during relief rallies, acting as a key level of mean reversion where the price returns to its medium-term average after being excessively oversold. Reaching this target within a projected two-week window would signify a successful retest of established resistance and would likely determine the long-term trend for the asset. If the price can successfully reclaim and hold above the $0.45 mark, it would invalidate the prevailing bearish narrative and potentially open the door for a more significant trend reversal. The 50-day SMA is a widely watched metric among both algorithmic trading systems and manual chartists, making it a natural focal point for profit-taking and technical evaluation as the rally progresses through its initial stages.
Achieving this target would also require a sustained increase in trading volume to confirm that the move is backed by genuine market interest rather than a temporary short-covering event. As the price approaches the $0.45 resistance zone, the behavior of the market will provide critical insights into whether the recovery has the legs to extend further or if it will simply result in another lower high. Professional traders often look for a decisive close above these moving averages to confirm a change in market character, as it demonstrates that buyers are willing to support the asset at higher valuations. The interaction at this level will be the ultimate test for the current bullish thesis, as it represents the boundary between a simple relief rally and the start of a broader structural recovery. Navigating this zone requires a careful balance of patience and agility, as the market typically experiences increased volatility and higher exchange activity once major psychological and technical price barriers are challenged.
Downside Protection and Invalidation Criteria
While the technical setup strongly favors an upward move, any professional market analysis must include clear parameters for risk management and potential invalidation of the bullish outlook. A breakdown below the $0.35 level would effectively negate the current recovery thesis, as it would indicate that the support floor has failed to hold against continued selling pressure. In such a scenario, the asset would likely face a retest of the deeper $0.31 support zone, which represents a critical historical level of interest for buyers. Maintaining a disciplined approach to these support levels is essential for protecting capital in the event of unforeseen market volatility or a broader downturn in the digital asset sector. By identifying these specific invalidation points, market participants can set clear stop-loss orders that limit their exposure while allowing the bullish trade setup enough room to develop according to the projected technical timeline and volatility expectations.
The current consensus among technical analysts remains optimistic, as the combination of oversold conditions and low-volume consolidation creates a high-probability opportunity for a mean-reversion move. However, the importance of monitoring broader market correlations cannot be overstated, as external factors often influence individual asset performance regardless of localized technical signals. If the overall sentiment in the layer-two ecosystem remains stable, the specific indicators for MATIC point toward a calculated recovery that rewards patient accumulation near the current price floor. This balanced perspective ensures that while the focus remains on the $0.45 target, there is a clear understanding of the risks involved if the market fails to sustain its current momentum. Ultimately, the synthesis of RSI levels, volume patterns, and moving average targets suggests that the asset is positioned for a strategic bounce that could redefine its market trajectory for the remainder of the current trading quarter.
Future Considerations for Market Strategy
Market participants should have focused on monitoring the daily closing prices relative to the $0.38 level to confirm that the accumulation phase remained intact during the transition period. It was essential to observe whether the Bollinger Bands began to expand upward, as this would have provided the first formal signal that the volatility squeeze was resolving in favor of the bulls. Traders who maintained a disciplined approach to risk management likely adjusted their positions as the asset approached the 50-day Simple Moving Average, treating that level as a primary zone for evaluating the strength of the rally. Moving forward, the focus should remain on the sustainability of trading volume, ensuring that any move toward $0.45 is supported by genuine demand rather than fleeting speculative interest. The ability of the asset to hold these newly reclaimed levels will be the determining factor in whether this relief move serves as a foundation for a more significant and lasting price appreciation.


