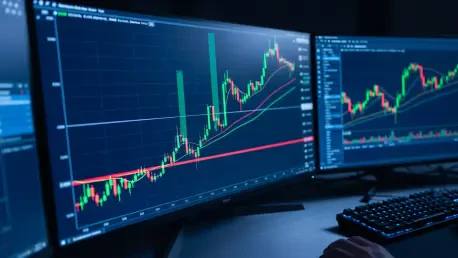

The recent price trajectory for LDO has caught the attention of market analysts as the token surged approximately thirty-four percent from its fifty-day moving average to reach a local peak of thirty-nine cents. This rapid appreciation has sparked an intense debate regarding the sustainability of the current rally, especially as technical indicators begin to signal that the asset is entering overbought territory. Investors are closely watching the volume indicators to determine if this move represents a genuine shift in market structure or a deceptive trap designed to lure in late buyers at the height of the expansion. The tension between short-term momentum and long-term valuation metrics has created a volatile environment where one wrong move could lead to a significant liquidation event. Consequently, the market is currently at a crossroads, balancing on the edge of a potential continuation toward previous highs or a deep correction that could wipe out the gains observed throughout this recent cycle. Market participants must now weigh the risk of entry against the potential for a sharp reversal.
Technical Support: Examining Volatility Barriers
Support Foundations: Evaluating the Moving Average Stack
LDO is currently positioned above several foundational support levels that serve as a multi-layered safety net against sudden downward volatility. The immediate level of interest is the 7-day moving average, situated at approximately thirty-seven cents, which has historically acted as a short-term pivot point for price action. Directly below this lies the more significant 200-day moving average at thirty-six cents, a metric that many institutional participants use as a definitive line between bullish and bearish long-term regimes. Maintaining a position above this long-term average is essential for preserving the broader positive sentiment, yet the current lack of aggressive buying pressure makes this floor look increasingly vulnerable. If the price fails to hold these specific levels, it could signal a shift in the market structure, potentially leading to a more prolonged consolidation period. This tiered support system provides a buffer, but it also highlights the narrow margin for error for bulls.
Growth Hurdles: Analyzing Resistance and Volatility
The immediate path toward higher valuation is currently obstructed by a formidable resistance zone at the forty-two-cent mark, a level that has consistently rebuffed upward attempts over the current cycle. Technical analysis indicates that the Average True Range for the token is presently compressed at a meager three cents, suggesting that the current market environment lacks the necessary volatility to punch through such a dense barrier. Without a significant external catalyst or a sudden influx of fresh capital, the likelihood of an explosive breakout above this resistance remains statistically low. This creates a challenging bottleneck where the price is prone to oscillating within a tight range, leading to investor fatigue and a potential loss of momentum. The convergence of low volatility and high resistance often precedes a period of distribution where early adopters begin to take profits, further weighing down the asset’s ability to reach new local highs in the immediate timeframe.
Protocol Value: Examining Market Sentiment
Positioning Gaps: Analyzing Divergences in Trader Sentiment
A notable discrepancy has emerged between the bullish sentiment expressed by top-tier traders and the underlying health of the broader market environment. While retail participants often chase the green candles of a thirty-four percent rally, secondary data points like Open Interest and funding rates have remained surprisingly stagnant throughout this latest move. This lack of growth in Open Interest suggests that the price appreciation is not being driven by new participants entering the space, but rather by existing holders who are choosing not to sell their positions. Such a scenario creates a brittle market structure where the absence of fresh liquidity makes the current price levels highly sensitive to any small-scale selling pressure. When a rally is built on the foundation of existing holdings rather than new capital inflow, it often lacks the structural integrity required to survive a sustained period of market-wide volatility or a shift in macroeconomic conditions during the trading year.
Utility Constraints: Comparing Governance and Protocol Success
There remains a persistent challenge regarding the fundamental value proposition of the LDO token compared to the immense success of the underlying Lido protocol itself. Lido continues to dominate the Ethereum liquid staking landscape, securing a vast amount of total value locked and maintaining its position as a critical infrastructure provider within the decentralized finance sector. However, the LDO token functions primarily as a governance instrument, which means its market price does not always move in tandem with the protocol’s operational achievements or revenue generation capabilities. This structural disconnect often places a psychological ceiling on the token’s price, as investors weigh the benefits of holding a governance asset against other tokens that offer more direct economic incentives or yield-bearing properties. Until there is a meaningful change in how governance tokens capture the value produced by their respective protocols, this gap will continue to influence how participants price the asset.
Strategic Forecasts: Identifying Potential Outcomes
Corrective Paths: Evaluating the Probability of Pullbacks
Looking ahead at the most probable market trajectories, the technical data points toward a high likelihood of a corrective pullback toward the thirty-seven-cent liquidity zone. Such a move would be considered a healthy development for the long-term price action, as it allows the Relative Strength Index to retreat from overbought levels and provides an opportunity for the market to reset its momentum. A shallow correction to this level would serve to test the strength of the current support base and could attract more disciplined buyers who were hesitant to enter during the initial vertical ascent. Conversely, if the token manages to consolidate above forty-one cents with a significant increase in trading volume, it would invalidate the current bearish divergence and open the door for a retest of higher resistance zones. However, without a clear signal of increased buyer conviction, the risk of a sharp retracement remains the primary concern for those who are currently managing risk in this asset.
Future Conditions: Determining Breakout Requirements
The market dynamics surrounding the recent rally suggested that a cautious approach was the most effective strategy for preserving capital in a volatile environment. Sophisticated participants avoided entering positions at the peak of the overbought cycle and instead prioritized waiting for a retest of the fundamental support levels between thirty-six and thirty-seven cents. By monitoring the relationship between price action and Open Interest, investors were able to identify the lack of fresh capital flowing into the ecosystem, which provided a clear signal that the rally was losing its internal strength. Moving forward, it became essential to focus on the development of new utility models within the governance structure that could bridge the gap between protocol growth and token valuation. Those who implemented strict stop-loss orders and waited for confirmed volume breakouts before committing new funds were better positioned to navigate the subsequent price fluctuations and eventually capitalize on the next trend.