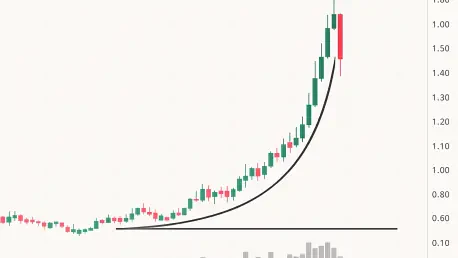

While retail investors often view vertical price spikes as the beginning of a generational wealth shift, Toncoin’s recent aggressive ascent toward the $1.85 mark presents a textbook example of a market reaching its absolute psychological and technical limit. This blistering 32% rally has sparked widespread celebration among latecomers, yet the underlying metrics suggest that the asset has entered a precarious “parabolic trap” phase. A sophisticated analysis reveals a growing chasm between the prevailing market enthusiasm and the cold technical reality, pointing to a potential 40% correction that could drag valuations back to the $1.10 support level.
The current environment demonstrates how price action can become decoupled from sustainable growth when speculative fervor takes control. History shows that vertical moves without established consolidation zones are prone to catastrophic failure. For Toncoin, the speed of this ascent created a liquidity void, meaning there are very few “buy walls” to catch the price if the momentum shifts. As the market reaches this tipping point, the probability of a sharp reversal increases, making it essential to evaluate whether the current floor is built on solid ground or mere hype.
The Evolution of Toncoin and the Psychology of Market Rallies
To accurately gauge the risks facing Toncoin, it is necessary to examine its transformation from a platform-integrated experiment to a dominant layer-one blockchain. Over the current cycle, TON has successfully cultivated a unique ecosystem that thrives on community-driven distribution; however, this same loyalty often leads to an echo chamber effect during periods of high volatility. Historically, Toncoin’s price action has been defined by long stretches of inactivity followed by sudden, violent expansions that frequently overshoot fair value.
These historical patterns are vital for understanding the current danger because they highlight the concept of “price exhaustion.” When an asset moves too far from its foundational utility, it relies entirely on the entry of new participants to sustain its valuation. In the absence of a cooling-off period, even the most promising blockchain projects experience mean reversion, where the price snaps back to its historical average. This cyclical nature reminds us that the higher the vertical climb, the more painful the inevitable descent tends to be for those who ignored the warning signs of overextension.
Dissecting the Technical Red Flags and Bearish Divergences
Momentum Exhaustion: The Warning Signs of Overbought RSI
A primary concern for the current trajectory is the extreme divergence appearing between price action and momentum oscillators. While the market price achieved local highs, the Relative Strength Index (RSI) climbed to a staggering 84.19, a level that almost universally precedes a significant pullback in the digital asset space. This condition indicates that the buying pressure is not only overextended but is operating in a zone of total exhaustion. Furthermore, the Moving Average Convergence Divergence (MACD) histogram has failed to produce higher peaks alongside the price, signaling that the strength behind each green candle is actually diminishing.
Structural Imbalances: The Risk of Mean Reversion
The structural health of the current rally is further undermined by the significant distance between the price and its key moving averages. Toncoin is currently trading nearly 40% above its upper Bollinger Band and is disconnected from its 20-day moving average, which sits far below at $1.38. Markets function like rubber bands; the further they are stretched from their mean, the more force they exert when they eventually snap back. Unless TON can establish a sideways consolidation pattern immediately, the gravity of these technical averages will likely pull the price downward, potentially triggering a cascade of liquidations among leveraged traders.
Derivatives DatThe Illusion of Organic Growth
Peering into the derivatives market reveals that this rally may be more of a “mirage” than a sign of fundamental strength. During the recent surge, open interest actually dropped by 33%, a clear indicator that the move was fueled by short squeezing rather than new capital entering the ecosystem. Additionally, a taker buy/sell ratio of 0.89 confirms that selling volume is quietly outpacing buying volume at these elevated levels. This suggests that “smart money” participants were actively distributing their positions to retail buyers who were entering the market based on fear of missing out, leaving the current price structure incredibly fragile.
Navigating Potential Volatility and Long-Term Market Shifts
Looking ahead, the longevity of Toncoin’s position in the market depends on its ability to attract institutional liquidity that can absorb the shocks of retail volatility. The lack of major fundamental catalysts in the immediate horizon makes it difficult for the asset to defend these high valuations against a broader market downturn. If regulatory pressures or macroeconomic shifts create a “risk-off” environment, overextended assets like TON are typically the first to see aggressive sell-offs. Predictions suggest that the coming weeks will likely serve as a mandatory “cleansing” period for the network’s market structure.
This anticipated correction is not necessarily a sign of project failure but rather a necessary step in the evolution of a maturing asset. By flushing out excessive leverage and resetting momentum indicators, the market creates a healthier foundation for the next stage of growth. However, in the short term, the absence of a sustainable accumulation phase means that the path toward $2.02 is blocked by a wall of sell orders, making a retracement the most statistically probable outcome.
Actionable Strategies for Managing Downside Risk in TON
For market participants, the priority shifted from seeking maximum gains to preserving capital in the face of extreme technical risks. Identifying the $1.40 level as the primary line of defense is crucial, as a breach of this support would likely accelerate the slide toward $1.19 or $1.10. Practical risk management involves the immediate tightening of stop-loss orders and the avoidance of large market orders at current peaks. Waiting for the RSI to return to a neutral zone below 50 provided a much safer framework for those looking to build or expand their positions without catching a falling knife.
Furthermore, investors benefited from observing the interaction between price and the 20-day moving average. A successful retest of this level could signal the start of a more organic uptrend, whereas a failure to hold it confirmed the bearish thesis of a 40% crash. In this environment, patience proved to be more profitable than participation, as the technical extremes reached during the rally made the probability of a deep correction nearly unavoidable for any disciplined trader.
Final Verdict: Assessing Toncoin’s Path Forward
The analysis of Toncoin’s market structure demonstrated that the parabolic rally was fundamentally unsustainable due to an overextended RSI and a lack of organic buy-side pressure. Technical indicators clearly favored a significant mean reversion, as the distance between the spot price and key moving averages reached a statistical breaking point. While the blockchain’s long-term potential remained intact, the short-term reality dictated a heavy correction to remove speculative froth from the system.
Strategic adjustments became mandatory once the derivatives data revealed that professional entities were offloading their holdings into retail enthusiasm. The market eventually sought a more stable equilibrium, proving that mathematical extremes in price action always necessitated a period of intense cooling. Ultimately, the transition from a vertical spike to a deep retracement served as a vital lesson in the importance of recognizing technical imbalances before they resulted in significant portfolio drawdowns.


