
Binance Coin (BNB) stands at a pivotal crossroads, as a significant price correction has pushed the asset into deeply oversold territory, catching the keen eye of traders and investors. Following a sharp 5.56% decline in 24 hours to a price of $593.89, technical indicators now signal a potential reversal on the horizon. This article delves into a comprehensive analysis of BNB’s current market position, exploring the technical data that suggests a possible recovery toward the $700 mark. By examining key support and resistance levels, on-chain metrics, and emerging market dynamics, it outlines the bullish and bearish scenarios facing the prominent exchange token and provides actionable insights for navigating its high-volatility environment.
The Path to the Present: BNB’s Recent Price Journey
To fully appreciate the significance of BNB’s current predicament, it is essential to understand its recent performance within the broader crypto market. As the native token of the world’s largest cryptocurrency exchange and the powerhouse behind the BNB Smart Chain, BNB’s valuation is often a bellwether for retail sentiment and decentralized finance (DeFi) activity. In the months prior, the coin experienced a robust uptrend, with analysts once setting ambitious targets near the $1,000 level. However, a market-wide downturn has since erased a portion of those gains, leading to the current bearish momentum. This correction has reset key technical indicators, creating the oversold conditions that now form the basis for a potential bullish reversal, making its next move critical for determining its trajectory for the coming weeks.
Deep Dive into BNB’s Technical Landscape
Decoding the Oversold Signals: RSI and Bollinger Bands
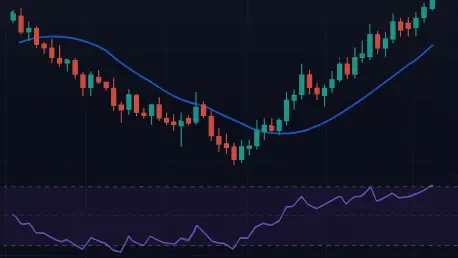
The most compelling argument for a near-term BNB recovery stems from its technical indicators, particularly the Relative Strength Index (RSI). Currently, BNB’s 14-period RSI sits at 22.29, a level that is widely considered to be deep in oversold territory. In technical analysis, an RSI reading below 30 often suggests that an asset’s price has fallen too quickly and may be due for a corrective bounce as selling pressure exhausts. This signal is further reinforced by the Bollinger Bands indicator, which shows BNB trading near its lower band. This combination typically indicates that the price has stretched too far from its average, increasing the probability of a mean reversion or a relief rally as buyers step in to capitalize on the lower prices.
The Battle for Momentum: Key Resistance and Support Levels
While oversold conditions suggest a potential bounce, the path to recovery is paved with critical price levels that will either fuel or stifle momentum. For a bullish scenario to materialize, BNB must first reclaim immediate resistance at $618.58. A decisive break above this level would open the door to subsequent targets at the 7-day Simple Moving Average of $628.94 and a stronger resistance at $643.27. Sustained buying pressure could then propel the asset toward the medium-term target of $680-$700. Conversely, the bearish case hinges on the breakdown of key support. If BNB fails to hold above immediate support at $581.08, it risks a test of the critical floor at $568.27. A failure at this level would invalidate the recovery thesis and likely trigger further selling toward the lower Bollinger Band support at $538.36.
On-Chain Metrics and Broader Market Sentiment
Beyond standard technical indicators, on-chain data and analyst sentiment provide additional context. On-chain analysis from platforms like CryptoQuant often shows that extreme RSI levels, like the one BNB is currently experiencing, frequently precede short-term price rebounds, especially when a significant portion of holders are at an unrealized loss. However, the broader market sentiment remains a powerful, external factor. A recovery for BNB is heavily dependent on the stability of major assets like Bitcoin and Ethereum. Any renewed market-wide fear or negative regulatory news could easily override the bullish technical signals, underscoring the importance of a holistic approach that considers both asset-specific indicators and macroeconomic trends.
Future Outlook: Volatility and Ecosystem Growth
Looking ahead, BNB’s future trajectory will be shaped by two primary forces: market-wide volatility and the continued growth of the BNB Chain ecosystem. The Average True Range (ATR) of $55.36 highlights the high volatility inherent in BNB, meaning sharp price swings in either direction can be expected. This environment can accelerate a recovery but also amplify downside risks. For sustained, long-term growth beyond a technical bounce, the fundamental value of the BNB ecosystem remains paramount. Innovations in DeFi, the expansion of its Web3 gaming sector, and the successful implementation of network upgrades will be crucial in attracting and retaining users, which in turn drives organic demand for the BNB token and solidifies its position as a blue-chip crypto asset.
Navigating the Trade: Strategies for BNB Investors
Based on the analysis, traders considering a position in BNB are presented with a high-risk, high-reward opportunity. For a potential entry, several strategies can be employed. A conservative approach would involve waiting for confirmation of a reversal, such as the RSI moving back above 30 and the price decisively reclaiming the $620 level. More aggressive traders might enter at current levels, using a tight stop-loss just below the critical support of $568.27 to manage risk. For long-term investors, a dollar-cost averaging (DCA) strategy, scaling into a position between the $580-$600 range, could mitigate the risk of timing the exact bottom. Regardless of the strategy, disciplined risk management, including limiting position size to 2-3% of a portfolio and taking partial profits at key resistance levels like $640-$650, is essential.
Concluding Thoughts: A Rebound in the Making?
In summary, Binance Coin is at a compelling inflection point where deeply oversold technical conditions suggest a strong potential for a relief rally toward the $650-$700 range. The confluence of a low RSI and the price touching its lower Bollinger Band creates a classic setup for a short-term reversal. However, this bullish outlook is contingent on BNB holding critical support at $568.27 and the broader cryptocurrency market maintaining its stability. The path forward is not without significant risks, and traders must remain vigilant. Ultimately, while the charts signal opportunity, confirmation through a sustained increase in volume and a break above key resistance levels will be the true test of whether BNB is ready to embark on a meaningful recovery.