
The digital asset landscape is currently navigating a phase of intense scrutiny as market participants look toward the mid-point of the decade for signs of sustained growth. Ethereum, the world’s leading smart-contract platform, finds itself at a pivotal junction where historical resilience meets modern market pressures. As the window for May approaches, the question of whether the asset can reclaim and stabilize at the $2,300 level has become a central theme for analysts and retail participants alike. This inquiry explores the feasibility of the price target by synthesizing technical data, recent trends, and broader sentiment.
By examining the current measured optimism that defines the ecosystem, one can establish a clear roadmap of what to expect as the deadline nears. This period represents a departure from the chaotic price discovery of previous years, moving instead toward a structured environment where every basis point is contested. Understanding the current trajectory requires a look at how the asset interacts with both its own internal metrics and the external economic forces that dictate global liquidity.
The Evolution of Ethereum from High-Growth Speculation to Stability
To understand the current $2,300 price target, one must consider the volatile journey the network has undertaken to arrive at this point of consolidation. In the years leading into the present, the asset experienced massive swings driven by institutional adoption and major technical network upgrades. However, the aggressive, speculative projections of $3,500 and beyond that characterized earlier cycles have largely given way to a more grounded perspective. This shift matters because it reflects a maturing market that is increasingly prioritizing on-chain utility and sustainable growth over hype-driven rallies.
Understanding this transition from explosive growth to data-driven consolidation is essential for interpreting why the current push toward $2,300 is viewed as a significant psychological and technical milestone. Investors have moved past the era of blind faith, demanding more robust proof of value before committing capital. Consequently, the asset now moves with a deliberate pace that favors long-term stability over short-term spikes. This evolution is not a sign of weakness but rather an indication that the platform is becoming a foundational layer of the global financial system.
Analyzing the Technical Divergence and Momentum Indicators
The Conflict: Neutral Momentum and Stagnant Trend Lines
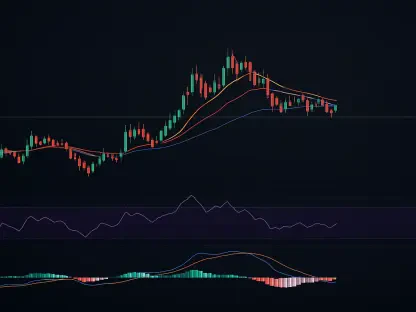
The current technical landscape for Ethereum is a study in contradictions, primarily highlighted by the divergence between the Relative Strength Index (RSI) and the Moving Average Convergence Divergence (MACD). Currently, the RSI sits at approximately 52.86, a neutral reading suggesting that the market is neither overextended nor depleted. However, while the RSI indicates balance, the MACD flatlines at zero, showing a lack of the bullish energy required for a decisive breakout. This suggest that while the asset isn’t in immediate danger of a crash, it lacks the immediate spark to surge toward $2,300 without a significant catalyst.
This neutral-to-stagnant environment poses a challenge for traders looking for quick returns but offers a period of relative calm for those focused on the long-term horizon. Without a surge in trading volume or a major fundamental announcement, the price action remains tethered to a narrow range. The lack of momentum essentially means that any upward movement is met with equal selling pressure, preventing the formation of a sustainable trend. Consequently, the market remains in a state of equilibrium that could persist until an external force disrupts the balance.
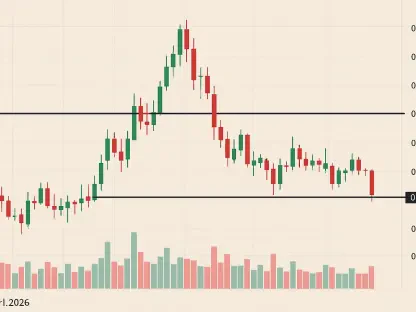
Volatility Measures: The Battle Over Resistance Levels
Volatility remains a double-edged sword for the ecosystem as it approaches the May window. Trading near the upper end of its Bollinger Band spectrum, the price faces immediate resistance near $2,214. The Average True Range (ATR) indicates that price swings remain wide enough to disrupt narrow trading strategies, meaning any move toward $2,300 will likely be characterized by significant noise. For the bulls to succeed, they must convert the short-term 20-day Simple Moving Average (SMA) support into a launchpad for higher valuations.
Failure to maintain this level could see the asset slip back toward the $1,900 zone, effectively invalidating the bullish thesis and reinforcing the bearish structure that has persisted since earlier in the year. The struggle at these levels illustrates the high stakes of the current price range. Each attempt to break through the ceiling is a test of the market’s conviction. If the resistance holds, the resulting rejection could be sharp, forcing a re-evaluation of the entire upward trajectory.
Macro Bearishness: Micro Bullish Recoveries
A critical complexity in the price forecast is the massive gap between short-term and long-term moving averages. While the asset has shown resilience by staying above the 20-day SMA of $2,091, it remains significantly below the 200-day SMA, which hovers near $2,981. This disparity reveals a fractured market where the micro-trend is recovering, but the macro-trend is still firmly bearish. Misunderstandings often arise when participants mistake a short-term bounce for a total trend reversal, leading to premature entries.
To reach $2,300, the platform does not need to enter a full-blown bull market, but it must prove it can bridge the gap between these two technical realities without being rejected by heavy overhead resistance. This “bridge” phase is often the most difficult part of a market cycle, as it requires consistent buying pressure over a sustained period. The divergence between these averages serves as a reminder that while the short-term outlook might look promising, the long-term path remains clouded by historical resistance.
Future Projections and Emerging Market Catalysts
As we look toward the remainder of the year, several emerging trends will likely shape the path to $2,300. The industry is moving away from the moonshot narratives of the past and toward institutional integration and regulatory clarity. Technological shifts, such as further refinements in Layer-2 scaling and energy efficiency, are expected to bolster the fundamental value of the network. Experts predict that the market will continue to favor a slow grind over vertical breakouts, as liquidity becomes more calculated and less speculative.
The evolution of the regulatory landscape in major economies will also play a decisive role in whether institutional buy-side pressure can provide the necessary tailwind. If clear frameworks are established, a new wave of capital could enter the space, targeting Ethereum for its utility rather than its volatility. This transition toward a utility-driven market suggests that price increases will be more reflective of actual network usage. As a result, the climb to $2,300 will likely be backed by tangible metrics rather than social media sentiment.
Strategic Takeaways for Investors and Market Participants
The analysis suggests that while the $2,300 target is achievable, it requires a disciplined approach to risk management. Investors should prioritize conservative accumulation, focusing on entry points in the $2,050 to $2,090 range rather than chasing price spikes. Best practices for the current environment include setting stop-loss orders below the $2,047 mark to guard against sudden volatility. For professionals and consumers alike, the key is to look past the daily fluctuations and focus on the structural battleground levels of $2,173 and $2,223.
Success in this market is not about predicting the exact day of a breakout, but about being positioned correctly for a gradual recovery. Diversification across Layer-2 solutions and staking protocols may provide additional layers of protection and yield during periods of price stagnation. Furthermore, staying informed on protocol upgrades will be vital, as these events often serve as the primary drivers for price appreciation in a mature market. By maintaining a focus on structural levels, participants can avoid the emotional pitfalls of a choppy market.
Navigating the Road to May
The journey toward the $2,300 price target was defined by a cautious recovery within a broader framework of consolidation. Technical data indicated that a slow grind was more likely than a sudden surge, with key support levels acting as the foundation for the eventual move upward. This period highlighted the importance of bridging the gap between micro-recoveries and macro-trends, ensuring that the market did not get ahead of its own fundamentals. As the network continues to mature, participants will need to adapt by using more sophisticated risk management tools and focusing on on-chain metrics. Future considerations must include the impact of institutional-grade financial products which may finally decouple the asset from the more volatile segments of the industry. The successful stabilization above current resistance levels would set the stage for a new era of price discovery driven by actual utility and institutional trust.