
The cryptocurrency Optimism currently finds itself at a pivotal crossroads, with its price action suggesting a tense battle between potential recovery and further decline. As of February 10, the digital asset is trading at a critical price of $0.18, following a recent 3.37% dip that has market participants closely monitoring key technical levels. While some indicators signal that the asset is significantly oversold and primed for a corrective bounce, a formidable wall of technical resistance casts a shadow over prospects for a swift and substantial bullish reversal. This analysis presents a cautious yet data-driven forecast, projecting a potential recovery into the $0.20 to $0.24 range by March. This outlook stands in stark contrast to more ambitious predictions from earlier in the year, suggesting that the path forward for Optimism may be more of a gradual climb than a parabolic surge, demanding a nuanced understanding of the conflicting market signals at play. The immediate challenge lies in breaking past initial hurdles, with the ultimate test resting at the significant $0.24 barrier.
Navigating the Technical Landscape
A comprehensive review of Optimism’s technical indicators reveals a predominantly bearish momentum, creating a challenging environment for any sustained price appreciation. The Moving Average Convergence Divergence (MACD) indicator, a key tool for gauging trend momentum, currently paints a discouraging picture. With its MACD line positioned at -0.0323, well below its signal line, and a flat histogram at 0.0000, the signal confirms that sellers are firmly in control. This bearish dominance is further reinforced by the positioning of all major moving averages, which now act as layers of overhead resistance. The 7-day Simple Moving Average (SMA) at $0.19 presents the first immediate obstacle, followed by the more substantial 20-day SMA at $0.24 and the 50-day SMA at $0.28. Each of these levels represents a price ceiling where selling pressure is likely to intensify, potentially stifling any upward movement. The Bollinger Bands also highlight the asset’s precarious position, with the price trading near the lower boundary, reinforcing the notion that while support may be near, the path to the middle band at $0.24 is fraught with difficulty.
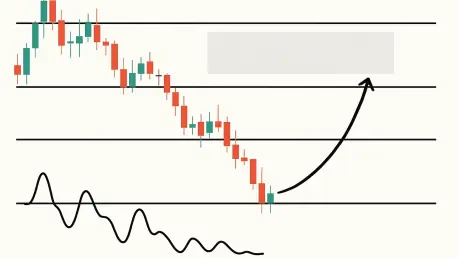
In direct contrast to the prevailing bearish momentum, the Relative Strength Index (RSI) offers a compelling argument for a potential short-term reversal. The RSI, a momentum oscillator that measures the speed and change of price movements on a scale of 0 to 100, is currently at 26.51 for Optimism. A reading below 30 is widely considered to place an asset in “oversold” territory. Historically, such low RSI values suggest that the recent selling pressure may be reaching a point of exhaustion. This condition often precedes a corrective bounce or a relief rally as the market recalibrates and buyers begin to see an opportunity. This oversold signal is the primary technical foundation for the forecast of a potential short-term recovery toward the initial resistance zone of $0.19-$0.20. While not a guarantee of a trend reversal, an oversold RSI provides a strong indication that the downside momentum is weakening, potentially giving bulls the foothold they need to initiate a pushback against the recent downtrend and test the formidable resistance levels looming overhead.
Conflicting Forecasts and Potential Scenarios
The current technical analysis, pointing toward a modest recovery to the $0.24 level, diverges significantly from the more optimistic forecasts issued by some market analysts in late January and early February. For instance, projections from Felix Pinkston and Lawrence Jengar anticipated Optimism reaching a much higher price range of $0.35 to $0.42 by March and February, respectively. Similarly, analysis by Ted Hisokawa identified a bullish potential that could propel the asset toward the $0.37-$0.42 range within a four-week timeframe. However, the emergence of significant technical headwinds and the persistent bearish momentum indicated by the MACD suggest that these more ambitious targets now appear increasingly out of reach. The on-chain data and current chart patterns point to a more arduous path to recovery, where breaking through multiple layers of resistance will require substantial and sustained buying pressure, a factor that has yet to materialize. This discrepancy underscores the dynamic nature of cryptocurrency markets and the importance of re-evaluating forecasts as new technical data becomes available.
Given the conflicting signals from various indicators, two distinct pathways emerge for Optimism in the near term. The bullish scenario hinges almost entirely on the oversold RSI triggering a significant relief rally. For this to materialize, the price must first decisively reclaim the immediate resistance zone between $0.19 and $0.20. If buyers can sustain this momentum, the next and most critical challenge would be the 20-day SMA at $0.24. A successful break above this level would signal a more meaningful shift in market sentiment. Confirmation for this bullish case would require the RSI to climb back above the 30 threshold, the MACD histogram to turn positive, and a noticeable surge in trading volume. Conversely, the bearish scenario would see the asset fail to overcome the initial resistance, leading to a retest of the critical support corridor at $0.17-$0.18. A breakdown below this floor would likely embolden sellers, potentially pushing the price down toward the lower Bollinger Band boundary, which currently sits near the $0.15 mark, marking a new local low for the asset.
A Measured Path Forward
For market participants contemplating an entry, the current technical setup suggests a cautious and methodical strategy is warranted. Rather than a single large purchase, a staged approach may mitigate risk. An initial entry could be considered within the established support zone of $0.17-$0.18, where the price has previously shown resilience. Should the price dip further, the area between $0.15 and $0.16, near the lower Bollinger Band, could present a secondary opportunity for accumulation. To manage downside risk effectively in a volatile market, implementing a firm stop-loss order just below the $0.15 level is advisable. On the upside, profit-taking targets should align with the key resistance levels identified in the analysis. The first target could be set at the $0.19-$0.20 range, with a more optimistic secondary target at the significant $0.24 barrier, contingent on the emergence of sustained bullish momentum. This strategy prioritizes risk management and realistic targets based on tangible technical levels over speculative hopes for a rapid return to previous highs.
In retrospect, the analysis advocated for a realistic and measured outlook on Optimism’s price potential. The glimmer of hope offered by the oversold RSI was tempered by a confluence of bearish signals, including a negative MACD and strong overhead resistance from multiple moving averages. This technical landscape suggested that the path to recovery was likely to be a gradual and challenging endeavor rather than a swift rally. The guidance emphasized focusing on tangible technical levels and employing robust risk management practices, advising against placing undue weight on the more speculative, higher-price targets from earlier analyst reports. Ultimately, the market’s reaction at these critical junctures provided a clear indication of underlying strength or weakness, setting the tone for Optimism’s broader market sentiment in the subsequent quarter.