
The world of digital asset forecasting requires a disciplined eye to distinguish between market noise and meaningful structural shifts. Joining us today is an expert in technical analysis who specializes in identifying these subtle pivot points within major altcoins. With a career built on navigating complex market cycles, our guest brings a wealth of knowledge on how momentum oscillators and price corridors dictate the flow of institutional and retail capital. Today, we delve into the specifics of Cardano’s current market positioning, exploring how a period of extreme neutrality often serves as the calm before a significant volatility expansion.
We will explore the nuances of identifying institutional accumulation during periods of technical equilibrium, the mechanics of trading within narrow Bollinger Band corridors, and the strategic implications of large gaps between current prices and long-term moving averages.
When technical indicators like the RSI sit near 50 and the MACD histogram is at zero, how do you distinguish between a temporary pause and a long-term trend reversal? Please elaborate with specific metrics or volume patterns that help identify if institutional accumulation is actually taking place.
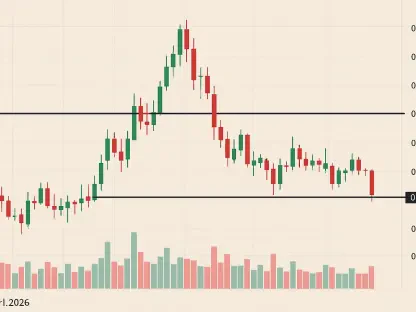
A reading of 49.93 on the RSI and a MACD histogram at exactly 0.0000 are the ultimate signals of technical equilibrium, where neither the bulls nor the bears have gained the upper hand. To distinguish a temporary pause from a reversal, I look closely at the relationship between price stability and participation; currently, Cardano shows a trading volume of $31.2 million on Binance, which suggests moderate interest but lacks the “climax” volume usually seen at a trend reversal. Institutional accumulation rarely happens in a vacuum, and we would need to see that volume spike significantly while the price holds firmly above the $0.25 support level. When the MACD is this flat, I watch for a “hidden” bullish divergence where the RSI begins to trend upward toward 60 while the price remains sideways. Without a surge in volume to back up a move beyond the neutral 50-line on the RSI, we are likely looking at a standard consolidation phase rather than a definitive change in the long-term trend.
Price action often becomes trapped in narrow corridors, such as a range between $0.23 and $0.27. What are the practical steps for managing a trade at these boundaries, and how can a trader use Bollinger Bands to confirm a legitimate breakout rather than a liquidity trap?
Managing a trade within a 12.5% corridor requires a high degree of patience and a “buy the floor, sell the ceiling” mentality. For Cardano, the lower Bollinger Band sits at $0.23 and the upper at $0.27, providing very clear technical boundaries that define the current playground for traders. To avoid a liquidity trap—where the price briefly pokes above $0.27 only to collapse—I look for a “walking the bands” scenario where the price closes outside the upper band and stays there for multiple sessions. A legitimate breakout is confirmed when the price uses the previous resistance at $0.27 as new support, accompanied by an expansion of the bands themselves. If the bands remain narrow and the price touches $0.27 on declining volume, it is a classic sign of an exhausted move that is likely to revert to the $0.25 mean.
There is currently a significant gap between short-term support levels at $0.25 and the 200-day moving average near $0.44. What historical precedents exist for closing such a large overhead gap, and what role does daily volatility, specifically a low ATR, play in this recovery?
The gap between the current price of $0.26 and the SMA 200 at $0.44 is a massive 69% overhead hurdle that acts as a significant “supply graveyard.” Historically, when an asset is this far below its 200-day average, the recovery is rarely a vertical line; instead, it involves a long “rounding bottom” or a series of higher lows. The current Average True Range (ATR) of $0.01 is particularly telling because it indicates that daily price swings are incredibly suppressed. While low volatility can lead to explosive moves, a $0.01 ATR suggests that the market lacks the current energy to bridge a $0.18 gap to the SMA 200 quickly. We would need to see the ATR double or triple alongside a breakout to believe the market has the momentum to challenge that $0.44 level, which currently serves more as a long-term target than a short-term reality.
In environments where daily price movement is restricted to roughly one cent, what specific adjustments should be made to position sizing and risk management? Could you share an anecdote or example of how over-leveraging in a low-volatility market can lead to unexpected losses?
In a market with a $0.01 ATR, the biggest danger is “boredom trading,” where a lack of movement leads traders to increase leverage just to make the potential profit feel significant. For Cardano right now, a conservative entry near the $0.24 support with a stop-loss just below $0.23 is the disciplined play, but the tight range means your margin for error is razor-thin. I remember a colleague who, during a similar low-volatility stretch, used 20x leverage thinking a $0.02 move was impossible; however, a sudden “stop-hunt” dipped the price just enough to liquidate his position before the price recovered. Because the corridor is only about $0.04 wide from bottom to top, over-leveraging transforms a healthy consolidation into a high-risk gamble. It is far better to size your position based on the $0.23 critical support level, ensuring that a stray wick doesn’t wipe out your capital before the real move to $0.28 or $0.30 begins.
What is your forecast for Cardano?
My forecast for Cardano is a continued period of range-bound consolidation between $0.23 and $0.28 over the next month, as the market lacks the institutional volume to break the gravitational pull of the 50-line RSI. Short-term, I expect ADA to gravitate toward the $0.24-$0.27 trading range, potentially testing the upper Bollinger Band at $0.27 if broader market sentiment turns slightly bullish. However, until the price can convincingly close above that $0.27 resistance with sustained volume, the substantial overhead supply at the $0.44 SMA 200 will keep the upside capped. For the coming week, we should anticipate a neutral to slightly bearish drift toward the $0.2463 mark, making it a “wait-and-see” environment for most disciplined investors.