
The decentralized finance landscape currently finds itself at a unique juncture where seasoned protocols like Curve Finance are being tested by both market apathy and technical consolidation. While the broader cryptocurrency market often moves in explosive cycles, the present environment for CRV is defined by a quiet, calculated compression that suggests a major shift is on the horizon. This roundup explores the converging technical perspectives that point toward a potential relief rally, examining whether the asset can finally shake off its persistent bearish weight to reclaim higher price territories.
Navigating the Critical Juncture for Curve Finance
As the decentralized finance landscape evolves, Curve finds itself at a pivotal technical crossroads in early 2026. This period is defined by intense price compression and a notable cooling of investor enthusiasm across the broader DeFi sector. Understanding the current market positioning is vital, as the asset balances on the edge of a potential relief rally against the backdrop of a prolonged downtrend. This analysis previews the technical indicators and strategic hurdles CRV must overcome to reclaim its short-term bullish momentum.
The protocol remains a cornerstone of on-chain liquidity, yet its token price has struggled to mirror its fundamental utility in recent months. Analysts observing the current setup note that the lack of mainstream hype might actually be a gift for patient investors. By stripping away the speculative noise that often clouds DeFi assets, the market is left with a raw technical structure that appears to be reaching a point of maximum pain for sellers. This exhaustion is frequently the silent catalyst needed for a trend reversal.
Assessing Momentum and Volatility Metrics
The Exhaustion of Selling Pressure and RSI Dynamics
The current technical landscape suggests that the aggressive liquidation phase for CRV may be nearing its end. With the Relative Strength Index (RSI) hovering near the 34.71 mark, the token is signaling significant oversold conditions that often precede a technical “dead cat bounce.” While the sentiment remains cautious, this proximity to the oversold threshold indicates that the bears are losing their grip, potentially allowing for a mean-reversion move as buyers begin to hunt for value in a market that has been pushed too far.
Observing the RSI in isolation can be misleading, but when paired with the steady decline in sell volume, it paints a picture of a market that has run out of conviction. Historically, when the RSI dips into this specific range, the risk-to-reward ratio begins to skew heavily in favor of the bulls. Even without a major fundamental catalyst, the sheer absence of new sellers can create a vacuum, allowing the price to drift upward as short-sellers begin to cover their positions.
Analyzing Stagnation Through MACD and Bollinger Bands
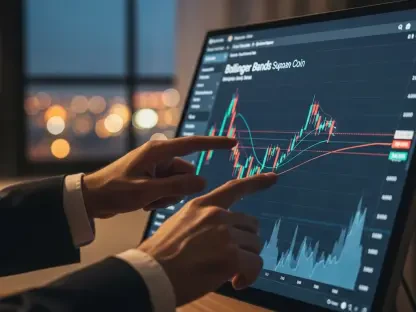
Current market volatility is being squeezed, as evidenced by CRV’s position relative to its Bollinger Bands. Trading at the lower extremity of $0.22, the asset is primed for a “return to the mean,” which aligns with the $0.24 middle band. Supporting this outlook is the MACD histogram, which has flatlined at 0.0000. This lack of directional momentum suggests that the previous bearish slide has lost its velocity, creating a vacuum that could be filled by a sudden influx of buying volume.
This state of equilibrium is often the precursor to a high-velocity expansion. When the MACD settles at the zero line, it reflects a temporary truce between buyers and sellers. For Curve, this sideways movement at the bottom of the Bollinger range is a classic “coiling” phase. If the price manages to hug the lower band without breaking beneath it, the eventual snap-back toward the $0.26 target could be swifter than most market participants expect.
Resistance Obstacles and Moving Average Hurdles
Despite the potential for a short-term bounce, the path to $0.26 is obstructed by several layers of technical resistance. CRV is currently trading well below its 200-day Simple Moving Average (SMA) of $0.44, confirming a dominant long-term bearish trend. To initiate a true recovery, the price must first reclaim the 7-day and 20-day SMAs, located between $0.23 and $0.24. These levels serve as the primary gatekeepers for any sustained upward movement.
The 200-day SMA acts as a heavy ceiling, representing the average price of the last several months and serving as a psychological barrier for institutional players. While the target of $0.26 is modest compared to that long-term average, the intermediate SMAs represent the immediate battlefield. Reclaiming these shorter-term averages would signal that the trend is shifting from a series of lower highs to a more constructive, stabilizing pattern.
The Impact of Market Silence and DeFi Sentiment
A unique factor influencing CRV’s price action is the current “quiet phase” in expert commentary and social engagement. As capital rotates toward blue-chip assets and major altcoins, protocol-specific tokens like Curve have seen a decline in liquidity and retail interest. This lack of attention can be a double-edged sword; while it limits the fuel for a massive breakout, it also means that the asset is largely ignored by speculative “weak hands,” potentially stabilizing the $0.20 support floor.
Moreover, the broader DeFi sector is currently undergoing a period of re-evaluation. Investors are no longer chasing every high-yield farm, instead focusing on protocols with proven longevity and sustainable fee structures. This shift in sentiment means that Curve must rely on its technical merit and fundamental stability rather than hype. If the $0.20 level holds during this period of relative silence, it will demonstrate a level of resilience that could serve as a foundation for the next market cycle.
Strategic Pathways for Market Participants
To navigate this high-volatility environment, traders must weigh the clear bullish and bearish scenarios currently in play. A successful flip of the $0.23 resistance into support could open the door for an 18% surge toward the $0.26 target. Conversely, a failure to defend the $0.20 psychological floor would likely trigger a cascade of sell orders, potentially driving the price down to the $0.18 range. Risk management is paramount, with tight stop-losses near support levels recommended for those looking to capitalize on the anticipated relief rally.
The divergence between these two paths highlights the importance of confirmation. Entering a trade at the current level requires a belief that the floor is solid, but more conservative strategies involve waiting for the price to close above the $0.24 mark on a daily timeframe. This approach reduces the risk of being caught in a continuation of the downtrend. Monitoring the volume profile during these tests of resistance will be the final piece of the puzzle for those seeking to validate the strength of the recovery.
Final Outlook on Curve’s Recovery Potential
The technical outlook for Curve pointed toward a cautiously optimistic short-term recovery, even as long-term challenges remained persistent. Market participants shifted their focus toward monitoring on-chain liquidity migrations, which provided a more nuanced view of protocol health than simple price action. It became clear that the path forward required not just technical strength, but also a renewed commitment to governance participation to drive organic demand.
Looking ahead, the evolution of decentralized exchanges will likely demand deeper integrations with cross-chain liquidity aggregators. For those following Curve, the focus moved beyond the $0.26 target to how the protocol would adapt to a multi-chain reality where capital efficiency is the primary metric of success. This transition suggested that while technical indicators provided the map for the immediate recovery, the long-term trajectory remained tied to the project’s ability to maintain its role as the primary venue for low-slippage stablecoin swaps. Moving forward, watching the interaction between protocol fees and token emissions became the standard for assessing sustainable value.