
Ethereum (ETH) currently stands at a pivotal market inflection point, trading near a critical support zone that could define its trajectory for the coming months. After a sustained downtrend, the digital asset is showing signs of potential exhaustion in selling pressure, presenting a precarious balance between a significant recovery and a further decline. This article delves into a comprehensive technical analysis of Ethereum as of February 8, 2026, exploring the key indicators, market sentiment, and price levels that will dictate its next major move. The technical landscape will be dissected to determine the viability of a bullish reversal toward the $3,100 target and outline the risks that could derail this optimistic forecast.
The Road to $2,000: Contextualizing the Current Downtrend
To fully appreciate Ethereum’s current position, it is essential to understand the context of its recent performance. The asset has been in a prolonged downtrend, a fact technically confirmed by its price trading significantly below key long-term indicators like the 200-period Simple Moving Average (SMA), which sits far higher at $3,607. This descent has brought ETH to its current trading price of approximately $2,095, a level that represents a multi-month low and a psychological battleground for bulls and bears. This price point is not arbitrary; it aligns with technical support zones that have historically attracted buying interest, making the current test a crucial moment for market participants looking for strategic entry points.
A Deep Dive into Ethereum’s Technical Landscape
Reading the Tea Leaves: Key Indicators Signal a Potential Shift
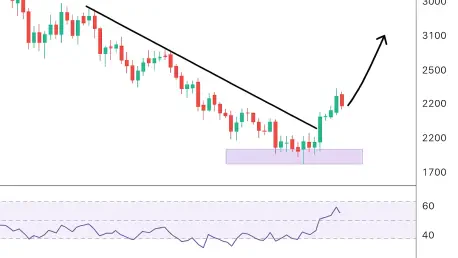
A closer examination of Ethereum’s technical indicators reveals a mixed but constructive picture. While the price position below its 20-period SMA ($2,581) confirms the immediate bearish trend, other metrics suggest a potential momentum shift. The Relative Strength Index (RSI) stands at 31.63, a neutral reading that is hovering just above the “oversold” threshold of 30. This proximity suggests that the recent selling pressure may be reaching a point of exhaustion. Furthermore, the Moving Average Convergence Divergence (MACD) histogram has flatlined at 0.0000, indicating that bearish momentum has completely stalled. This halt is often a precursor to a potential reversal, as the market pauses to find its next direction.
Navigating Volatility: Bollinger Bands Define the Battlefield
The Bollinger Bands provide a clear framework for Ethereum’s immediate price action and volatility. With ETH trading near the lower band (at $1,789), the market has found an initial floor, suggesting this level is acting as strong support. Any significant bullish rally would first need to overcome the middle band, which coincides with the 20-period SMA at $2,581, before targeting the upper band at $3,373. The Average True Range (ATR) of $221.73 confirms that daily volatility remains high, presenting both significant risk and opportunity for traders navigating this tight price range. These bands effectively define the current battlefield, with a break above the middle line signaling a bullish shift and a fall toward the lower band confirming bearish control.
Market Sentiment vs. Technicals: A Bullish Consensus Emerges
While technical indicators paint a picture of a stalled downtrend, broader market sentiment appears more decisively bullish. Forecasts from analytical platforms like CoinCodex and MEXC News anticipated a price recovery into the $3,350 to $3,660 range for early February, reflecting an underlying belief in Ethereum’s strength. Looking at the full year, InvestingHaven projects a highly volatile but ultimately bullish 2026, with a potential trading range between $1,669 and $6,500. This optimism is further supported by on-chain data, which suggests that long-term investors view the current proximity to multi-month lows as a strategic accumulation opportunity, betting on a future price appreciation.
The Path Forward: Mapping Bullish and Bearish Scenarios
Based on the current technical and market landscape, two clear and opposing paths emerge for Ethereum. The bullish case hinges on a decisive, high-volume break above the immediate resistance at $2,197. Clearing this hurdle would open the door to the $2,581 level. A sustained move above that would signal a true trend change, bringing the $3,100-$3,350 range into focus. Conversely, the bearish scenario unfolds if Ethereum fails to hold support. A break below $2,023 would likely trigger a sell-off toward the stronger support at $1,951. A failure to hold this line would expose ETH to a deeper correction toward the lower Bollinger Band near $1,789, representing a potential 15% downside.
Strategic Positioning: Actionable Entry Points and Risk Management
For traders and investors, the current price offers a compelling risk-reward profile for a medium-term position. A conservative strategy would involve waiting for a retest of the $2,023 support level to enter, with a stop-loss placed just below the critical $1,951 support. A more aggressive approach could involve scaling into a position between $2,050 and $2,100, targeting the $2,197 resistance as an initial profit-taking level. If this resistance is broken decisively, traders could add to their position, targeting the $2,350-$2,600 zone next. In either scenario, disciplined risk management is paramount given the elevated volatility.
Final Verdict: A Pivotal Moment for Ethereum’s Trajectory
In summary, Ethereum is at a critical juncture where waning bearish momentum is meeting a floor of strong technical support and optimistic market sentiment. While the prevailing trend remains bearish according to its moving averages, multiple indicators suggest a bottom may be forming. The forecast for the next four to six weeks favors a gradual recovery toward the $2,350-$3,100 range. However, this bullish outlook is entirely contingent on buyers stepping in to push the price above the formidable $2,197 resistance. Failure to do so will keep Ethereum vulnerable to a further correction, making the current price level a defining moment for its near-term future.