
While many digital assets capture headlines with erratic swings, Litecoin stands at a pivotal junction where price suppression masks a sophisticated period of market maturation. As of early April, the asset finds itself navigating a critical technical crossroads, characterized by a persistent period of sideways trading and cautious sentiment among market participants. While the immediate price action suggests a bearish lean, a deeper dive into the underlying data reveals a complex narrative of consolidation rather than a complete collapse. This analysis explores the juxtaposition between the short-term technical struggles of the token and its significant recovery potential. By evaluating current momentum, structural support levels, and institutional forecasts, this report provides a comprehensive outlook on why this period of stagnation serves as a prelude to a significant growth phase targeted for later this year.
The Historical Context: Litecoin’s Legacy of Market Resilience
To understand the current position of the asset, one must look at its historical role as the silver to the gold of Bitcoin. Over the years, Litecoin has undergone numerous cycles of extreme volatility followed by extended periods of horizontal movement. These phases of consolidation have historically served as a foundation for broader market recoveries. Past industry shifts, such as the implementation of the MimbleWimble Extension Block (MWEB) and various halving events, have shaped its current landscape as a reliable, high-liquidity asset. Understanding these background factors is essential for grasping why current undervaluation is often viewed by seasoned market participants as a cyclical opportunity rather than a permanent decline.
The persistent resilience of the network is not merely a product of age but a result of consistent uptime and wide integration across payment processors. Unlike many speculative tokens that fade after a single market cycle, this network has maintained its relevance through utility. The current undervaluation—marked by a significant gap from long-term moving averages—highlights a disconnect between price and network health. For those who track the fundamental growth of active addresses and transaction volumes, the current price floor represents a historical anomaly that often precedes a major shift in investor appetite.
Technical Health and Momentum Indicators
Examining the Neutral Sentiment: RSI and MACD Analysis
The technical landscape is currently defined by a wait-and-see approach, best illustrated by the Relative Strength Index (RSI). Sitting at 44.45, the RSI indicates that the asset is in neutral territory, neither overbought nor fully exhausted. This lack of clear momentum is mirrored by the Moving Average Convergence Divergence (MACD), which has essentially flatlined at -0.0000. Such metrics suggest that while the bears have a slight edge, the selling pressure is losing its velocity. This stabilization often precedes a volatility squeeze, where the price remains tightly coiled before a decisive breakout occurs based on upcoming market catalysts.
Structural Barriers: The 200-Day Moving Average
A more concerning aspect of current health is the position of the asset relative to major structural averages. It is currently trading below its 7-day Simple Moving Average (SMA) of $53.32, which acts as a ceiling for immediate price recovery. More importantly, the substantial distance between the current price of approximately $53.27 and the 200-day SMA at $78.45 highlights a persistent long-term downtrend. Until the price can challenge and reclaim these higher levels, the broader market structure remains bearish. However, for contrarian investors, this massive gap represents a potential mean reversion opportunity if the market sentiment shifts toward a recovery phase.
Volatility Squeezes: Bollinger Band Boundaries
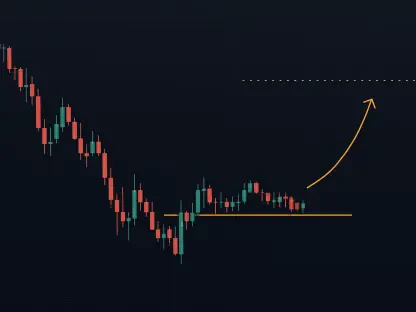
The current position on the Bollinger Band scale further reinforces the consolidation narrative. Trading at 0.27, the asset is significantly closer to the lower boundary of $51.46 than the upper resistance of $58.25. This proximity to the lower band often indicates that the price is reaching a temporary floor. If it can hold above the $52.42 support level, it sets the stage for a potential bounce toward the upper bands. Conversely, a breach of these lower levels could signal a more profound decline, making these boundaries essential lines in the sand for traders monitoring short-term risk.
Emerging Trends: The Roadmap to Future Valuation
Looking ahead, several emerging trends and institutional forecasts point toward a constructive recovery. Analysts maintain that the token is fundamentally undervalued, with price targets ranging from $71.77 by the end of the current year to $89.06 by the conclusion of the cycle. This projected upside of 35% to 67% is predicated on a broader market recovery and increased institutional adoption of established proof-of-work assets. Additionally, potential regulatory shifts that favor decentralized, non-security tokens could provide the necessary tailwinds for the asset to break out of its technical malaise and reclaim its historical valuation tiers.
Strategic Entry: Risk Management Recommendations
For those looking to navigate this consolidation phase, a disciplined and layered entry strategy is recommended to mitigate volatility risks. A primary entry zone between $52.40 and $52.80 allows investors to capitalize on current support, while a secondary layer between $51.50 and $52.00 provides a buffer for minor price dips. To protect capital, a stop-loss is advised near the $50.80 mark, as a drop below this psychological level could invalidate the immediate bullish recovery thesis. Success in this market required patience, as initial profit-taking targets should be conservatively set at $55.50 and $58.25 until a clear trend reversal is confirmed by increased trading volume.
Reflecting on the Path: Strategies for Market Stabilization
The analysis of the asset presented a tale of two distinct timeframes. While the immediate future was characterized by price compression and technical hurdles, the long-term outlook remained rooted in a recovery narrative that targeted significant growth. The consolidation within the $51.00 to $55.00 range felt stagnant, yet it served as a crucial period for price discovery and base building. By monitoring key support levels and staying informed on broader industry shifts, investors managed to navigate this period of uncertainty. Ultimately, the ability of the network to maintain its structural integrity during this phase determined its capacity to reach the ambitious targets set for the coming months. These steps ensured that participants were well-positioned for the eventual shift in momentum.