
A significant downturn in the cryptocurrency market has pushed Binance Coin (BNB) into a technically oversold position, a condition that historically precedes notable price recoveries for major digital assets. Currently trading at $640.49, the asset’s Relative Strength Index (RSI) has fallen to an extreme low of 25.91, signaling that selling pressure may be reaching a point of exhaustion. This development has captured the attention of market analysts, who are now closely monitoring key technical indicators for signs of a reversal. While the broader market sentiment remains cautious, the specific metrics for BNB suggest that a bounce could be imminent. The primary question now is not if a recovery will occur, but rather the potential magnitude and timeline of such a move, with technical analysis pointing toward a potential climb back to the $750-$850 range within the next four to six weeks if specific support levels hold firm against further selling pressure.
1. Expert Outlook and Prevailing Market Sentiment
Despite the recent price weakness that has characterized the market, recent analyst sentiment for Binance Coin has maintained a cautiously optimistic tone, focusing on the underlying technical strength that could fuel a future recovery. In January, some market observers projected bullish momentum for BNB, with forecasts suggesting the asset could challenge the $950 to $1,050 price range by February. These predictions were based on technical indicators that, while now showing short-term bearishness, pointed to a strong underlying structure capable of supporting significant upward movement once market conditions stabilized. While these targets may appear ambitious from the current vantage point, they highlight the high-growth potential that experts see in the asset. The discrepancy between these earlier forecasts and the current price action underscores the market’s inherent volatility but also reinforces the idea that a substantial recovery is plausible as oversold conditions typically normalize over time, attracting strategic buyers back into the market.
The current technical framework for Binance Coin continues to suggest that the asset is well-positioned for a significant recovery, even in the face of prevailing market headwinds and more conservative short-term expectations. The foundational analysis that led to earlier, more aggressive price targets remains relevant, as the core network fundamentals have not materially changed. The key lies in the normalization of technical indicators from their current extreme levels. The deeply oversold RSI, for instance, is a classic signal that often attracts value-oriented investors and traders looking to capitalize on a mean reversion. The consensus among many analysts is that while the path to recovery may be volatile, the technical setup is constructive. A short-term target of $680 to $720 within the next week is seen as a realistic first step, with a more substantial move toward the $750 to $850 range anticipated over the course of the next month, contingent on the asset holding its critical support levels and the broader market finding a stable footing.
2. A Deep Dive into Technical Indicators
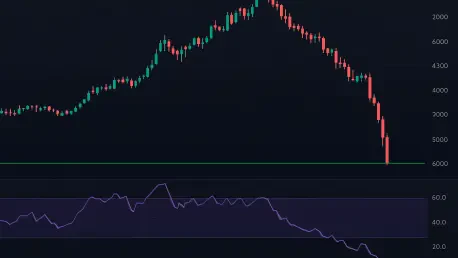
The current technical landscape for Binance Coin is presenting a textbook case of an oversold asset ripe for a potential reversal, with multiple indicators signaling that the recent downward momentum may be nearing its end. The most prominent signal comes from the Relative Strength Index (RSI), which has plunged to 25.91. An RSI reading below the 30 threshold is widely considered to indicate oversold conditions, and such extreme readings have historically served as reliable precursors to significant price bounces for established cryptocurrencies like BNB. Complementing the RSI is the MACD (Moving Average Convergence Divergence) histogram, which is currently sitting at 0.0000. This flat reading suggests that the bearish momentum that has driven the price down is potentially exhausted, creating an environment where bullish pressure can begin to build. These indicators, when viewed together, form a compelling argument that the path of least resistance may soon shift to the upside as sellers exit the market and buyers begin to see an attractive entry point.
Further examination of BNB’s position relative to its key moving averages reveals a substantial disconnect that often precedes a strong corrective move, a phenomenon known as mean reversion. Trading at $640.49, the coin is positioned significantly below all its major trend-following indicators: it is 6.2% below its 7-day Simple Moving Average (SMA) of $682.71, a steep 20.1% below its 20-day SMA of $801.38, and a considerable 30.3% below its 200-day SMA of $919.44. Such a wide divergence from these long-term averages is typically unsustainable and tends to resolve with the price moving back toward these trend lines. Adding to this analysis, the Bollinger Bands provide further context. With a %B position of 0.0960, BNB is trading very close to its lower Bollinger Band at $602.29, a level that often acts as dynamic support. The middle band, which corresponds to the 20-day SMA at $801.38, now represents a primary and logical target for any ensuing recovery, while the upper band near $1,000.47 marks the territory for a full-fledged bullish breakout.
3. Potential Scenarios and Key Price Levels
The primary bullish case for Binance Coin is anchored in the concept of mean reversion from its current deeply oversold state, suggesting a high probability of a corrective bounce in the near future. The initial hurdle for buyers to overcome is the immediate resistance level at $666.19. A decisive break above this point, which represents approximately a 4% upside from current levels, would serve as the first confirmation that a recovery is underway. Such a move would likely inject fresh momentum into the market, paving the way for a test of the 7-day SMA at $682.71. However, the more significant and widely anticipated recovery target is the 20-day SMA, located near $801.38. Reaching this level would represent a substantial 25% gain from the current price and would validate the oversold bounce thesis. For a complete bullish trend reversal to be confirmed, BNB would need to reclaim the crucial 50-day SMA at $854.05. Surpassing this significant moving average could open the door for a more extended rally, potentially targeting the $950-$1,050 range that was highlighted in earlier analyst forecasts.
Conversely, the bearish scenario hinges on the failure of key support levels to hold against sustained selling pressure. A breakdown below the immediate support at $629.81 would be the first warning sign, potentially leading to a test of the more robust support zone at $619.13. This level is critical; a failure to defend it would likely intensify bearish sentiment and could trigger a new wave of selling toward the lower Bollinger Band, currently situated around $602.29. The most concerning outcome for bulls would be a daily close below the psychological and technical support level of $600. Such a breach would invalidate the immediate recovery thesis and could signal the onset of a deeper correction. In this scenario, market participants would likely adjust their expectations downward, with the next logical support areas falling within the $550 to $580 range. This would represent an additional downside risk of 14% to 19% from the current price and would indicate that the broader market weakness has more influence than BNB’s oversold technical indicators.
Navigating the Path Forward
The technical analysis revealed that Binance Coin’s price action had entered a critical phase defined by its oversold status. The convergence of a low RSI, a flattening MACD, and a significant deviation from key moving averages strongly suggested that the asset was positioned for a potential rebound. The examination of both bullish and bearish scenarios provided a clear framework of key price levels that would likely dictate the asset’s trajectory in the short to medium term. The bullish case centered on a mean reversion toward the 20-day and 50-day SMAs, while the bearish outlook depended on the breach of critical support zones. Ultimately, the data pointed toward a tactical opportunity driven by technical exhaustion, but it also underscored the importance of external factors, such as the performance of Bitcoin and the overall sentiment in the cryptocurrency market. The high daily volatility, as indicated by the ATR, served as a final reminder that any trading strategy required disciplined risk management to navigate the potential price swings effectively.