
The current landscape of digital finance is witnessing a significant moment of tension as Stellar (XLM) hovers near the $0.16 threshold, a level that many market observers consider a definitive line in the sand for the asset’s medium-term trajectory. As of April 2026, the market is characterized by a high degree of indecision, where the aggressive momentum of previous quarters has transitioned into a strategic consolidation phase. Investors are currently weighing the fundamental utility of the Stellar network against technical resistance that has historically capped rapid price appreciation. This period of stagnation is not merely a pause in trading activity but a critical juncture where the balance between supply and demand is being tested, determining whether the asset possesses the necessary liquidity and institutional interest to ignite a rally toward the anticipated $0.20 target.
Expert Predictions and Market Sentiment
Professional Growth Projections for 2026
Market analysts specializing in distributed ledger technologies have presented a wide spectrum of possibilities for Stellar throughout the remainder of 2026, often citing the influence of global liquidity shifts on alternative assets. Some prominent financial forecasts suggest that the asset could experience extreme volatility, with potential trading ranges expanding from a conservative $0.14 floor to an ambitious $0.40 ceiling. This divergence in opinion highlights the speculative nature of the current environment, where a single macroeconomic shift or a major institutional partnership could serve as a catalyst for a massive breakout. The broader sentiment remains cautiously optimistic, as many believe that the ongoing integration of blockchain into traditional banking systems provides a structural tailwind that favors Stellar’s unique position as a bridge for fiat currencies and digital tokens.
Beyond the generalized forecasts, a more structured school of thought identifies $0.20 as a pivotal psychological and technical milestone for the middle of 2026. This projection is largely predicated on the observed increase in on-chain activity and the growing volume of cross-border remittances being settled via the Stellar protocol. Analysts who favor this targeted outlook argue that while the asset faces significant hurdles at the $0.17 and $0.18 levels, the consistent demand for low-cost, high-speed settlement remains a core driver of value. By focusing on fundamental network growth rather than just speculative trading patterns, these experts suggest that a gradual and sustainable climb toward $0.20 is more likely than a sudden, volatile spike, provided that the network maintains its current pace of technological adoption and decentralized governance stability.
The Role of Institutional Adoption and Network Utility
The institutional landscape for Stellar has matured significantly by 2026, moving away from experimental pilot programs toward large-scale implementation of central bank digital currencies and private stablecoin issuance. This shift in usage patterns creates a baseline demand for XLM, which is required for account initialization and transaction fees, effectively reducing the liquid supply on open exchanges over time. As more fintech companies integrate the Stellar anchor system to facilitate international payments, the correlation between network utility and token price becomes more pronounced. Financial strategists point out that this utility-driven demand acts as a stabilizing force during periods of market-wide volatility, making the $0.20 target a reflection of the network’s intrinsic value rather than just a product of temporary retail excitement or speculative fervor.
Furthermore, the sentiment within the developer community and among major stakeholders indicates a focus on enhancing the smart contract capabilities of the network, which has opened new doors for decentralized finance applications. This evolution from a simple payment rail to a multifunctional ecosystem has bolstered the confidence of long-term holders who view the $0.16 consolidation as an accumulation phase. While the broader cryptocurrency market often moves in sync with major assets, Stellar’s independent progress in the regulatory and compliance space provides a unique narrative. Investors are increasingly looking at how these fundamental advancements will translate into market performance, with many concluding that the current price levels represent a significant undervaluation relative to the actual volume of value moving across the network daily.
Decoding Technical Indicators and Price Action
Moving Averages and Momentum Oscillators
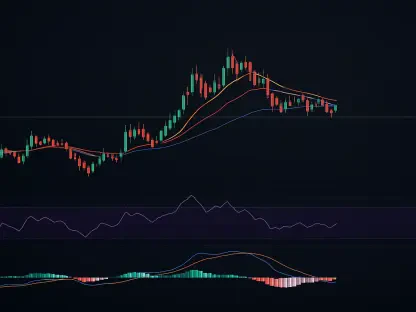
Technically, Stellar finds itself in a precarious yet promising position as it struggles to maintain its footing above the 50-day Simple Moving Average (SMA). While the asset has successfully defended the $0.16 level, it remains constrained by the 20-day SMA, which currently acts as a ceiling for short-term price action. More importantly, the gap between the current price and the 200-day SMA of $0.24 suggests that the asset is still recovering from a long-term bearish cycle that began in previous years. This configuration typically requires a substantial influx of buying volume to bridge the divide, as the lack of immediate upward momentum can lead to investor fatigue. However, the stability at the current level is often viewed by technical analysts as a sign of price floor discovery, suggesting that the worst of the selling pressure may finally be exhausted.
Momentum oscillators provide a more nuanced view of the current market dynamics, with the Relative Strength Index (RSI) hovering in a neutral zone that signals neither exhaustion nor exuberance. In contrast, the Stochastic indicators have slipped into oversold territory, a condition that historically precedes a corrective bounce as buyers step in to capitalize on perceived discounts. The Moving Average Convergence Divergence (MACD) has also transitioned into a flat histogram, indicating that the bearish trend has lost its acceleration. When these indicators align—a neutral RSI combined with oversold Stochastics and a stabilizing MACD—the resulting technical setup often favors a bullish reversal. This convergence of metrics suggests that the market is primed for a move, and the lack of further downward movement at $0.16 reinforces the idea that a foundation for the next rally is being built.
Volatility Analysis and Trading Volume Trends
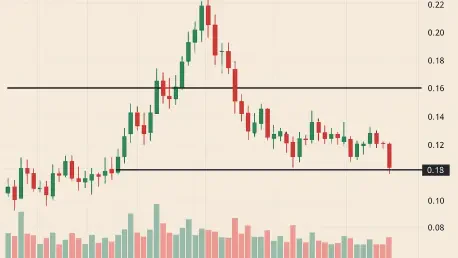
The current volatility profile of XLM, as interpreted through Bollinger Band analysis, shows a narrowing of the price range, which often serves as a precursor to a significant expansion. With the lower band currently protecting the $0.16 support and the upper band situated near $0.18, the asset is essentially trapped in a volatility squeeze. Historically, such periods of low volatility lead to explosive moves once a breakout occurs. For the bulls to take control, a surge in daily trading volume is essential, as the current average of $6.45 million is considered insufficient to sustain a long-term trend reversal. A spike in volume accompanied by a break through the $0.17 resistance would confirm that the squeeze is resolving to the upside, potentially setting the stage for a rapid ascent toward the mid-year objective.
In addition to pure price action, the relationship between liquidity and market depth at the $0.155 to $0.165 range suggests that there is a significant cluster of limit orders waiting to be filled. This “liquidity pocket” acts as a buffer against sudden flash crashes, providing a sense of security for swing traders looking for entry points. However, the lack of aggressive “market buy” orders indicates that participants are waiting for a definitive signal from the broader market before committing more capital. Monitoring the order book depth reveals that the resistance levels are not as thick as they were in previous months, suggesting that once a momentum shift begins, there will be less friction to impede the journey toward $0.20. The technical narrative is currently one of coiled energy, waiting for a fundamental spark to release it.
Evaluating Potential Bull and Bear Scenarios
Path to $0.20 and Risk Management Factors
The roadmap for Stellar to reach the $0.20 mark involves a series of technical hurdles that must be cleared with conviction. The first step is a sustained close above the $0.17 level, which would flip the short-term 20-day SMA from resistance into support. Following this, the asset must challenge the $0.18 threshold, which aligns with the upper Bollinger Band and represents a key psychological barrier for retail traders. If the market environment remains supportive, a successful breach of these levels would likely trigger a wave of FOMO (fear of missing out), driving the price toward the final $0.20 destination. This bullish scenario is contingent on the absence of negative regulatory shocks and a steady increase in the utilization of Stellar’s payment corridors, which would provide the fundamental backing needed for a 25% price appreciation.
Conversely, a bearish outlook cannot be ignored, especially if the $0.16 support fails to hold under renewed selling pressure. A breakdown below this level would likely lead to a test of the $0.15 support floor, representing a potential loss of over 6%. Should the broader market experience a downturn, or if specific negative news regarding the Stellar Development Foundation emerges, the price could descend toward the yearly low of $0.14. To manage these risks, disciplined market participants often utilize stop-loss orders just below the $0.15 mark to protect their capital from a structural breakdown. This defensive posture is critical in a market where sentiment can shift rapidly, and maintaining a clear exit strategy is just as important as identifying a profitable entry point during these periods of consolidation.
Strategic Adjustments for Future Market Dynamics
As the market approaches the middle of the year, the most effective strategy for navigating Stellar’s price action involved a combination of patience and technical precision. Market participants who successfully anticipated the move toward $0.20 often did so by identifying the $0.16 level as a high-probability accumulation zone, while carefully monitoring the 20-day SMA for signs of a trend shift. Moving forward, it is essential to look beyond simple price targets and focus on the health of the network, such as the total value locked in liquidity pools and the growth of active wallets. These metrics often provide an early warning of shifting demand before the price reflects it. Staying informed about interoperability updates and new bridge protocols will be vital for those looking to capitalize on Stellar’s role in the evolving digital economy.
The conclusion of this phase of consolidation was marked by a gradual shift in market leadership from sellers to buyers, driven by a stabilization in macroeconomic indicators. For those who observed the technical signals, the transition from neutral momentum to a defined bullish trend offered a clear window for portfolio rebalancing. In the future, the focus should shift toward how Stellar maintains its position above the $0.20 mark and whether it can convert this previous target into a long-term support level. Continued attention to the development of the Soroban smart contract platform and its impact on network fee structures will provide the next set of insights for long-term valuation. Ultimately, the successful navigation of the mid-year volatility demonstrated that a disciplined approach to risk management remains the most reliable path for achieving consistent results in the digital asset space.