
The digital asset landscape is currently witnessing a sophisticated evolution as Floki navigates a critical technical crossroads that has captured the intense scrutiny of both retail speculators and institutional analysts. No longer dismissed as a mere dog-themed curiosity, the asset has matured into a significant market indicator for high-volatility environments, effectively mirroring broader shifts in global investor sentiment and decentralized finance participation. This transition reflects a maturation of the meme-coin sector, where technical precision and ecosystem utility have begun to supersede simple social media hype.
As market participants evaluate the current trajectory, it becomes clear that Floki serves as a barometer for the appetite for risk in the broader alternative coin market. The significance of its current price action lies in its ability to dictate sentiment for a vast array of secondary assets. This analysis provides an exhaustive exploration of the metrics currently governing its movement, examines the consensus from major financial platforms, and projects the bullish and bearish paths that could define its performance through the middle of the year.
Current Market Dynamics and Technical Indicators
Quantifying Momentum: RSI, MACD, and Stochastic Data
The Relative Strength Index currently hovers at 38.64, a level that signals a steady approach toward oversold conditions and suggests the asset is entering an undervalued state. This specific numerical threshold is often viewed by technical traders as a precursor to a stabilization phase, as the intensity of selling pressure begins to wane. While the asset has not yet dipped into the deep oversold territory below 30, the downward drift indicates that the market is searching for a bottom where long-term holders might find the entry price attractive enough to resume accumulation.
In contrast to the cooling RSI, the Moving Average Convergence Divergence maintains a stagnant profile at 0.0000, which underscores a period of heavy market consolidation. This lack of divergence suggests that short-term and long-term price averages are moving in a tight parallel, effectively neutralizing aggressive momentum in either direction. Furthermore, the Bollinger Band %B level at 0.1815 places the price near the lower envelope, a zone that has historically functioned as a springboard for reversals during previous cycles of price compression.
Market Stabilization and Price Corridor Behavior
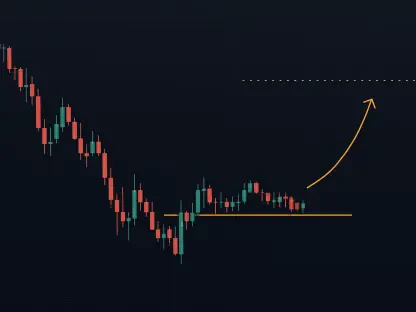
The current trading environment is defined by a rigid range between the $0.000025 support floor and the $0.000035 resistance ceiling. Within this corridor, market participants are actively seeking a new equilibrium, balancing intraday price fluctuations against the backdrop of broader economic stability. This consolidation phase is not merely a pause in action but a period of intensive price discovery where liquidity flows are being recalibrated. The $0.000030 mark has emerged as a vital psychological level, acting as a pivot point that often determines the immediate direction of short-term retail behavior.
Observing price behavior within these boundaries reveals a tug-of-war between liquidations and opportunistic buying. When the price touches the lower boundary of the corridor, buy-side pressure tends to increase as algorithmic traders respond to the oversold stochastic signals. Conversely, as the asset approaches the $0.000035 resistance, sell orders often cluster, reflecting a cautious approach by those looking to take profits amidst the prevailing neutral momentum. This rhythmic movement within the corridor suggests that a major breakout will require a significant shift in external market catalysts.
Expert Perspectives on Market Sentiment
Synthesis of consensus views from industry leaders at major financial hubs indicates a remarkably unified outlook on the asset’s current neutral momentum. Analysts at AInvest Coin Buzz and MEXC News have noted that the early stages of the current cycle are characterized by a “wait-and-see” approach, where institutional interest remains sidelined until a clear trend emerges from the consolidation. This collective caution is reflected in the dampened volatility indices, which suggest that the era of erratic, sentiment-driven spikes is being replaced by more calculated, data-driven trading patterns.
Moreover, perspectives from Blockchain.News highlight the tightening correlation between Floki and the primary market leaders, such as Bitcoin and Ethereum. As these foundational assets undergo their own periods of refinement, Floki’s performance is increasingly seen as a leveraged bet on the health of the entire ecosystem. Expert insights suggest that the asset’s technical maturity is now high enough that it no longer moves in total isolation, but rather as a sensitive component of a larger, interconnected financial web that rewards structural strength over fleeting popularity.
Future Projections and Strategic Trajectories
Exploration of the Bullish Scenario: The Path to Upside
A bullish move toward the $0.000035 target would necessitate a specific sequence of technical and fundamental catalysts. Primarily, a sustained increase in trading volume must accompany any breach of the $0.000030 psychological barrier to confirm that the move is supported by genuine demand rather than a temporary short squeeze. A successful RSI shift back above the 50 midline would signal that buyers have regained control of the narrative, potentially sparking a 30% rally as the asset tests the upper limits of its current range.
Evaluation of the Bearish Scenario: Risks of Support Breaches
On the other hand, the bearish scenario carries significant risks if the critical $0.000025 support level is compromised. A decisive close below this floor could invalidate the current consolidation thesis and invite a deeper correction toward the $0.000020 mark. Such a move would likely be precipitated by a broader retreat in the meme-coin sector or a sudden shift in global liquidity. Investors monitoring this trajectory often utilize tiered entry points and strict stop-loss measures to mitigate capital erosion during these high-velocity downward shifts.
Long-Term Implications: Balancing Origin and Maturity
The long-term outlook for the ecosystem depends on its ability to successfully balance its dog-themed origins with an increasingly sophisticated technical framework. As the project integrates more deeply with DeFi protocols and expands its utility, the market’s perception of its value is expected to shift from speculative to fundamental. This transition is essential for maintaining relevance in an environment where investors are increasingly demanding transparency, utility, and sustainable growth models over purely speculative gains.
Conclusion and Strategic Summary
The technical landscape for Floki was defined by a period of significant compression, where the tension between oversold indicators and stagnant momentum signals created a period of relative equilibrium. The $0.000025 to $0.000035 range served as the primary battlefield for price discovery, forcing market participants to adopt more disciplined entry and exit strategies. Analysts focused on the necessity of monitoring broader market sentiment as the ultimate catalyst for the next trend shift, recognizing that individual asset metrics are rarely sufficient to predict a breakout in an interconnected market. Looking ahead, the focus should remain on the development of tiered risk management systems that can account for sudden volatility. Success in the coming months will likely depend on the ability to interpret these technical signals in real-time, allowing for a proactive rather than reactive approach to capital allocation in the evolving digital economy.