
The digital asset market is currently witnessing a high-stakes standoff as XRP attempts to navigate a complex web of technical hurdles and shifting institutional expectations in mid-April 2026. While the broader cryptocurrency sector has shown flashes of volatility, Ripple’s native token has settled into a tight consolidation phase, hovering near the $1.34 mark with a sense of deliberate hesitation. This price action comes at a time when the community is intensely focused on whether the asset can reclaim its former momentum or if it will succumb to the gravitational pull of recent bearish revisions. The current environment is characterized by a significant decrease in impulsive buying, replaced instead by a methodical assessment of the token’s actual utility within the global financial infrastructure. Investors are closely monitoring the interplay between daily trading volumes and the emerging resistance levels that have historically dictated the asset’s short-term trajectory.
Analyzing Market Sentiment and Technical Indicators
Current Market Position and Institutional Outlook
The institutional landscape for XRP has undergone a rigorous transformation throughout early 2026, as major financial entities recalibrate their long-term valuation models based on real-world adoption metrics. Standard Chartered, previously a staunch proponent of an $8.00 price target, recently made headlines by slashing its projection to $2.80, a move that sent ripples of caution through the retail trading community. This adjustment is not merely a reaction to price fluctuations but is deeply rooted in the slower-than-anticipated growth of transaction volumes on the XRP Ledger (XRPL). While the technological framework remains robust, the pace at which global banks are integrating the ledger for cross-border settlements has faced logistical and regulatory friction. Consequently, the market is currently pricing in a more conservative growth curve, shifting the narrative from speculative euphoria to a more grounded focus on measurable utility and sustainable network expansion.
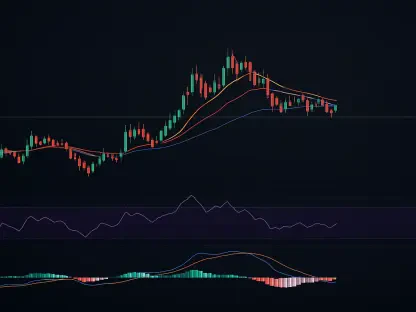
Building on this institutional shift, the internal mechanics of the market reveal a neutral-to-bearish bias that is currently suppressing aggressive upward movements. The Relative Strength Index (RSI) is maintaining a steady position around 44.24, which traditionally indicates that sellers still hold a slight edge without pushing the asset into oversold territory. This lack of clear direction is further evidenced by a stagnant Moving Average Convergence Divergence (MACD) histogram, which remains virtually flat at 0.0000. Such technical paralysis often precedes a significant breakout, but without a fundamental catalyst, the asset remains trapped in a localized range. Despite this lack of momentum, exchange liquidity remains surprisingly resilient, with platforms like Binance reporting steady daily volumes exceeding $129 million. This suggests that while the price is not moving, the underlying interest from market participants has not evaporated, creating a coiled spring effect that could react sharply to the next major news cycle or regulatory development.
Technical Hurdles and Moving Average Resistance
As XRP attempts to stage a recovery, it faces a formidable “ceiling” created by a cluster of Simple Moving Averages (SMAs) that have historically acted as pivot points for trend reversals. The immediate challenge lies at the $1.37 level, which represents the 20-day SMA; reclaiming this point is widely considered the first prerequisite for any credible bullish thesis. Just above this sits the 50-day SMA at $1.39, forming a narrow corridor of resistance that has repeatedly rebuffed recent attempts at a rally. If the asset cannot close decisively above these marks on a daily timeframe, the likelihood of a sustained upward move remains low. These short-to-medium-term averages are currently trending downward or sideways, reflecting the lack of conviction among buyers who are waiting for a more favorable entry point or a clear signal that the recent period of consolidation has finally reached its logical conclusion.
Furthermore, the significant gap between the current price and the 200-day SMA, which currently rests at $1.98, highlights the macro-level challenges facing the asset. This long-term average serves as a stark reminder that XRP is still operating within a broader downward trend when viewed through a wider lens. Until the price can bridge the gap toward this long-term indicator, the market is likely to treat any minor gains as relief rallies rather than the start of a new bull cycle. The Bollinger Bands currently provide a volatility framework that places the upper limit near the $1.47 target, suggesting that while there is room for a 10% appreciation, the asset is currently drifting closer to the lower support band of $1.27. This positioning indicates that the path of least resistance might lean toward a retest of lower support levels before any serious attempt at the $1.47 objective can be mounted by the bulls in the current trading environment.
Evaluating Potential Price Paths and Trading Strategies
Bullish Breakouts versus Bearish Risks
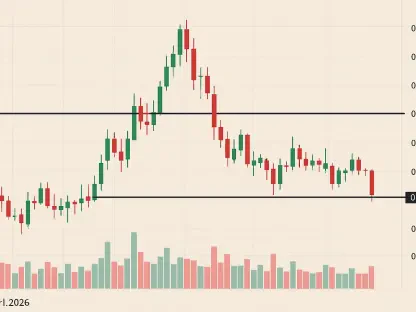
The potential for a bullish breakout depends heavily on a sudden influx of buying pressure that can flip the $1.37 and $1.39 resistance levels into foundational support. In this optimistic scenario, a decisive move backed by a spike in trading volume would likely target the upper Bollinger Band at $1.47, a level that has not been tested with conviction in recent weeks. Such a move would require a shift in the Relative Strength Index toward the 50 to 60 range, signaling that momentum has finally transitioned into the hands of the buyers. A successful breach of $1.47 would not only represent a significant psychological victory but would also open the door for a challenge of the $1.55 zone. However, this path is fraught with the risk of “fake-outs,” where the price briefly touches these levels only to be met by a wave of profit-taking from traders who have been sidelined during the recent period of stagnation and are eager to exit at breakeven.
In contrast, the bearish risks remain a looming concern for those focused on capital preservation, as the proximity to the $1.30 support floor creates a precarious situation. Should the $1.30 mark fail to hold, technical analysts point toward the $1.25 region as the next significant line of defense, which represents a potential 7% decline from current levels. This zone is considered “strong support,” but a breach there could trigger a cascade of automated sell orders and margin liquidations, potentially driving the price toward the lower extremes of the yearly range. The current Average True Range (ATR) of $0.05 suggests that while daily swings are not catastrophic, they are large enough to shake out poorly positioned traders. This environment necessitates a cautious outlook, as the market seems more inclined to penalize over-leveraged positions than to reward speculative bets. The lack of a clear bullish catalyst means that the risk of a slow, grinding decline remains a very real possibility.
Strategic Entry Points and Risk Management
For market participants looking to navigate this period of uncertainty, the primary focus must be on disciplined execution rather than chasing mid-range fluctuations. Conservative strategies currently favor waiting for a confirmed retest of the $1.30 support level, where a bounce accompanied by a bullish divergence in technical oscillators would provide a high-probability entry point. This approach allows for a clearly defined exit strategy, as a daily close below $1.28 would invalidate the setup and signal a deeper correction. By prioritizing entries at established support, traders can significantly improve their risk-to-reward ratios, ensuring that they are not buying into the “middle of nowhere” while the asset is still searching for a definitive floor. This patient methodology is often the hallmark of institutional-grade trading, particularly during phases of low volatility and high institutional skepticism.
Alternatively, more aggressive participants are closely watching for a momentum-based entry triggered by a breach of the $1.37 resistance cluster. In this scenario, the trade is predicated on the idea that once the immediate ceiling is broken, the path to $1.47 becomes relatively clear of major obstacles. To mitigate the inherent risks of this strategy, traders are advised to utilize trailing stop-losses and to monitor the 15-minute and 1-hour charts for signs of exhaustion near the target price. The use of the $0.05 ATR as a guide for stop-loss placement can help prevent being stopped out by standard market noise, which is frequent in the current liquidity environment. Ultimately, success in the mid-April market will likely depend on the ability to remain flexible and reactive to the $1.37 inflection point. Moving forward, the key consideration for any portfolio adjustment should be the ongoing monitoring of XRPL transaction metrics, as these will likely provide the fundamental fuel needed to finally push the asset toward its long-term institutional targets.