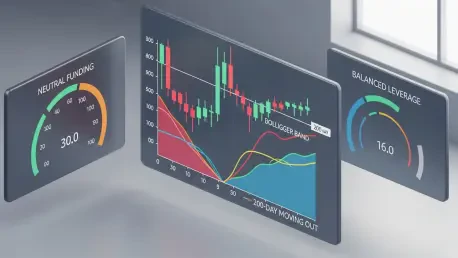

HBAR sat coiled around $0.09 while volatility slid to multi‑month lows, and that rare compression—paired with balanced leverage and seasonal strength—tilted probabilities toward a directional break that tended to travel farther and faster than consensus expected. The setup mattered because Bollinger Bands pinched as price hugged the upper band, signaling quiet pressure from persistent bids rather than a lack of interest, and because both retail and institutions leaned long without frothy funding, a combination that historically supported follow‑through when a trigger arrived [1][7].
This analysis mapped the evidence, placed it in real‑world context, and translated it into scenarios with defined levels. The core claim was simple: hold the $0.088–$0.09 shelf and the path toward $0.12–$0.15 over four to six weeks stayed open; lose $0.085 with authority and the playbook switched to defense [2][3].
Market Structure and Volatility Compression Around $0.09
Market structure tightened into a “launch pad” where the 7‑, 20‑, and 50‑day SMAs clustered near $0.09, compressing distance to the 200‑day near $0.12, the first true test of trend strength [2]. That geometry reduced noise, curtailed false signals, and concentrated energy; prior HBAR clusters of this type preceded 20–40% expansions within a month or so [2].
Moreover, activity stayed constructive without overheating: daily volume hovered near $5.03 million as price advanced a restrained 0.95% during the squeeze, a tell that liquidity rotated rather than chased [1]. With BB position near 0.91, bids persisted at the upper rail even as realized range narrowed, a hallmark of accumulation [1].
1) Evidence of a Coiled Spring: Bands, Momentum, and Liquidity
Indicators corroborated the build‑up. RSI around 57.38 favored steady accumulation over distribution, while a flat MACD histogram implied latent direction rather than exhaustion [1]. Stochastic near 90 warned of brief shakeouts that often precede expansion, putting emphasis on reaction at nearby support [1].
The level map remained clean: support at $0.088, invalidation on a decisive break below $0.085, first resistance at the 200‑day near $0.12, with follow‑on objectives at $0.135 and $0.14–$0.15 derived from prior impulse ranges and Fibonacci extensions [2]. Respecting those signposts kept risk defined even if volatility abruptly widened.
2) Historical Analogs and Adoption Context
Seasonality reinforced the technicals. January–February delivered historically strong HBAR returns, averaging above 30%, and the current compression rhymed with pre‑breakout phases that resolved higher after brief dips [3]. Case studies showed that tight bands plus SMA stacking often produced multi‑week advances, even when early false breaks rattled weak hands before recovery [2][4].
Narrative depth mattered too. Hedera’s governing council and enterprise‑grade integrations in areas like supply chain provenance, tokenized assets, and sustainability reporting sustained relevance, providing fundamental scaffolding when technical triggers fired [5][6]. Relative to peer large‑caps in similar cycles, HBAR’s volatility and liquidity mix compared favorably, enhancing the setup’s quality [4].
Expert and Desk Perspectives on the Setup
Derivatives positioning added a behavioral edge. Retail sat 61.8% net long while institutions registered 66.1% net long—an uncommon convergence that strengthened directional bias without crowding [7]. Funding near neutral (~0.0084%) and an 8.66% open‑interest reset pointed to cleaner books after weak‑hand exits, while a taker buy/sell ratio of 0.67 suggested short‑term selling flow that could become fuel if price held support [7].
Momentum desks flagged the BB squeeze plus clustered SMAs as a high‑probability catalyst, and quants emphasized the neutral MACD against elevated Stochastic as a recipe for shallow dips before trend expansion [8]. Risk managers kept focus on the first proving ground: acceptance above the 200‑day around $0.12 to open a path toward $0.135–$0.15; failure below $0.085 shifted posture to capital preservation with eyes on $0.075 [2][8].
Forward Scenarios, Targets, and Risk Management
The base case envisioned upside resolution within four to six weeks toward $0.12, then $0.135, and a stretch to $0.14–$0.15 if the 200‑day flipped to support, keeping risk‑reward above 6:1 to conservative targets [2][3]. An alternate path allowed a quick cool‑off into $0.088–$0.09 as Stochastic eased, followed by an orderly rotation of volume back into bids [1][8].
Execution hinged on discipline: entries around $0.088–$0.092, a stop near $0.085, and staged exits at $0.12, $0.135, and $0.14–$0.15, while reassessing if funding spiked or open interest surged without price progress [7][8]. Watchpoints included sustained acceptance above the 200‑day, balanced leverage, green‑day volume expansion, BTC dominance trends, and Hedera ecosystem headlines that could accelerate flows [5][7][8].
Conclusion and Call to Action
This squeeze framed a clear trade: compression near $0.09, supportive breadth, and rare retail–institutional alignment with neutral funding favored an upside resolution if support held [1][2][7]. The path forward prioritized monitoring BB width, the 200‑day interaction, and derivatives balance, then acting at defined levels while staying nimble around shakeouts. Should $0.085 have failed, plans shifted to wait for a fresh base and renewed accumulation signals, preserving capital for the next high‑quality attempt.